Wavelet Analysis

| Multiresolution Approximation Plots |
One way of presenting reconstructions is in a multiresolution approximation plot. In this plot reconstructions of the input data are shown by level. At any level the reconstruction at that level uses only the detail and scaling coefficients defined below that level.
The following statement produces such a plot, starting at level 3:
call mraApprox(decomp, ,3, ,"Quartz Spectrum");
The results are shown in Figure 19.8.
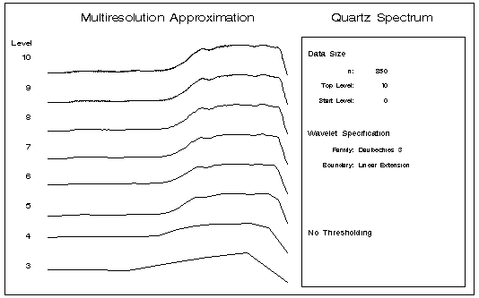
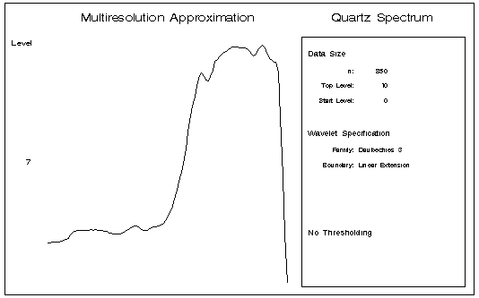
You can see that even at level 3, the basic form of the input signal has been captured. As noted earlier, the oscillation present in the absorbance data is captured in the detail coefficients higher than level 7. Thus, the reconstructions at level 7 and lower are largely free of oscillation since they do not use any of the higher detail coefficients. You can confirm this observation by plotting just this level in the multiresolution analysis as follows:
call mraApprox(decomp, ,7,7,"Quartz Spectrum");
The results are shown in Figure 19.9.
You can also plot the multiresolution approximations obtained with thresholded detail coefficients. For example, the following statement plots the top-level reconstruction obtained by using the "SureShrink" threshold:
      call mraApprox(decomp,&SureShrink,10,10,
                     "Quartz Spectrum");
The results are shown in Figure 19.10.
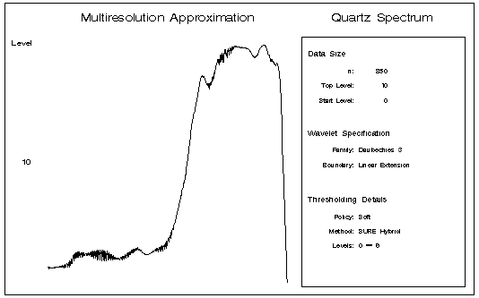
Note that the high-frequency oscillation is still present in the reconstruction even with "SureShrink" thresholding applied.