| Robust Regression Examples |
Example 9.7: Stackloss Data
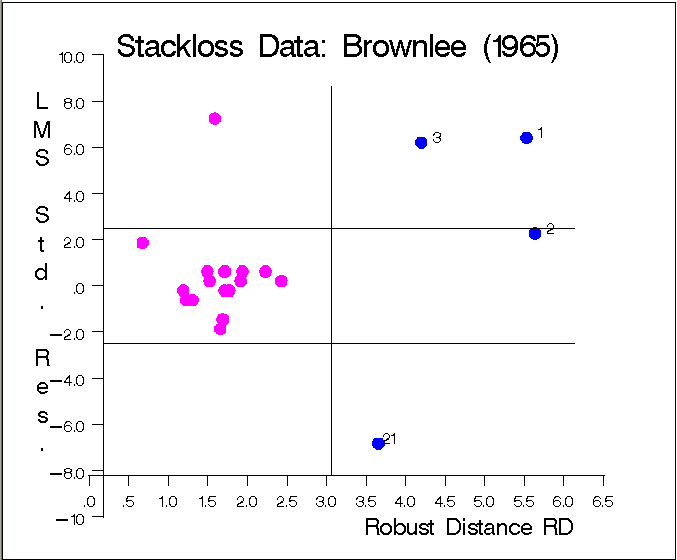
The graphs in Figure 9.7.1 and Figure 9.7.2 show the following:
- the plot of standardized LMS residuals vs. robust distances

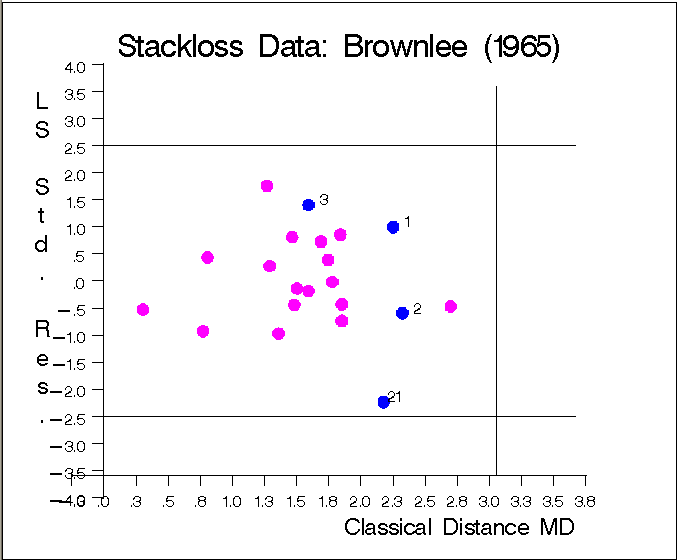
- the plot of standardized LS residuals
vs. Mahalanobis distances

|
Output 9.7.2: Stackloss Data: LS Residuals vs. Mahalanobis Distances
|
Copyright © 2009 by SAS Institute Inc., Cary, NC, USA. All rights reserved.