| Graphics Examples |
Example 12.2: Train Schedule
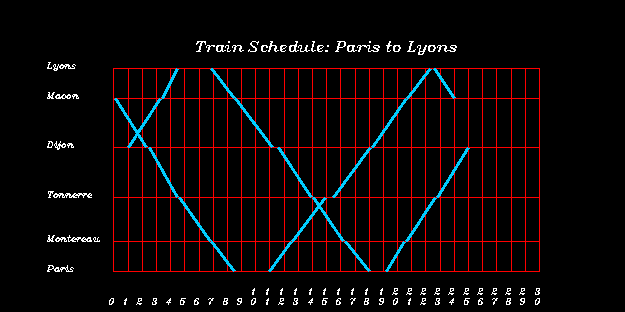
This example draws a grid on which the horizontal dimension gives the arrival/departure data and the vertical dimension gives the destination. The first section of the code defines the matrices used. The following section generates the graph. The following example code shows some applications of the GGRID, GDRAWL, GSTRLEN, and GSCRIPT subroutines. This code produces Figure 12.11.
    proc iml;
    /*  Placement of text is based on the character height.      */
    /*  The graphics segment defined here assumes percent as the */
    /*  unit of character height for device independent control. */
       goptions gunit=pct;

       call gstart;
       /* Define several necessary matrices  */
       cityloc={0 27 66 110 153 180}`;
       cityname={"Paris" "Montereau" "Tonnerre" "Dijon" "Macon" "Lyons"};
       timeloc=0:30;
       timename=char(timeloc,2,0);
       /* Define a data matrix  */
       schedule=
          /* origin dest start  end       comment */
             { 1     2   11.0  12.5,   /* train 1 */
               2     3   12.6  14.9,
               3     4   15.5  18.1,
               4     5   18.2  20.6,
               5     6   20.7  22.3,
               6     5   22.6  24.0,
               5     4    0.1   2.3,
               4     3    2.5   4.5,
               3     2    4.6   6.8,
               2     1    6.9   8.5,
               1     2   19.2  20.5,   /* train 2 */
               2     3   20.6  22.7,
               3     4   22.8  25.0,
               4     5    1.0   3.3,
               5     6    3.4   4.5,
               6     5    6.9   8.5,
               5     4    8.6  11.2,
               4     3   11.6  13.9,
               3     2   14.1  16.2,
               2     1   16.3  18.0
             };

       xy1=schedule[,3]||cityloc[schedule[,1]];
       xy2=schedule[,4]||cityloc[schedule[,2]];

       call gopen;
       call gwindow({-8 -35, 36 240});
       call ggrid(timeloc,cityloc,1,"red");
       call gdrawl(xy1,xy2,,"blue");

       /*-- center title -- */
       s = "Train Schedule: Paris to Lyons";
       call gstrlen(m, s,5,"titalic");
       call gscript(15-m/2,185,s,,,5,"titalic");

       /*-- find max graphics text length of cityname --*/
       call gset("height",3);
       call gset("font","italic");
       call gstrlen(len, cityname);
       m = max(len) +1.0
       call gscript(-m, cityloc,cityname);
       call gscript(timeloc - .5,-12,timename,-90,90);
       call gshow;

    quit;
    goptions gunit=cell;            /*-- reset back to default --*/
|
Figure 12.11: Train Schedule
Copyright © 2009 by SAS Institute Inc., Cary, NC, USA. All rights reserved.