| Graphics Examples |
Example 12.1: Scatter Plot Matrix
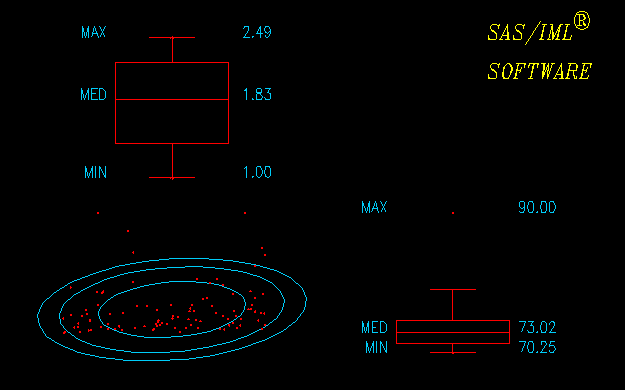
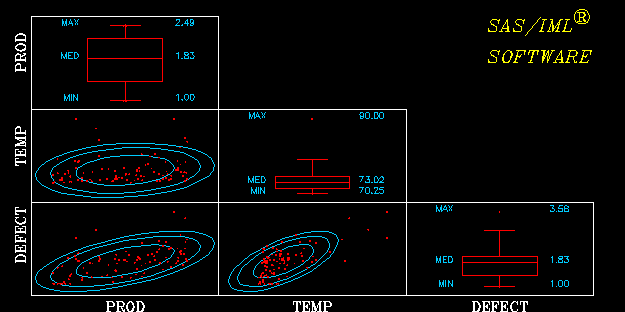
With the viewport capability of the IML graphics subroutine, you can arrange several graphs on a page. In this example, multiple graphs are generated from three variables and are displayed in a scatterplot matrix. For each variable, one contour plot is generated with each of the other variables as the dependent variable. For the graphs on the main diagonal, a box-and-whiskers plot is generated for each variable.
This example takes advantage of user-defined IML modules:
- BOXWHSKR
- computes median and quartiles.
- GBXWHSKR
- draws box-and-whiskers plots.
- CONTOUR
- generates confidence ellipses assuming bivariate normal data.
- GCONTOUR
- draws the confidence ellipses for each pair of variables.
- GSCATMAT
- produces the
 scatter plot matrix,
where
scatter plot matrix,
where  is the number of variables.
The code for the five modules and a sample data set follow. The modules produce Figure 12.9 and Figure 12.10.
       /* This program generates a data set and uses iml graphics     */
       /* subsystem to draw a scatterplot matrix.                     */
       /*                                                             */
    data factory;
      input recno prod temp a defect mon;
      datalines;
        1   1.82675    71.124   1.12404   1.79845         2
        2   1.67179   70.9245  0.924523   1.05246         3
        3   2.22397    71.507   1.50696   2.36035         4
        4   2.39049   74.8912   4.89122   1.93917         5
        5   2.45503   73.5338   3.53382    2.0664         6
        6   1.68758   71.6764   1.67642   1.90495         7
        7   1.98233   72.4222   2.42221   1.65469         8
        8   1.17144   74.0884   4.08839   1.91366         9
        9   1.32697   71.7609   1.76087   1.21824        10
       10   1.86376   70.3978  0.397753   1.21775        11
       11   1.25541    74.888   4.88795   1.87875        12
       12   1.17617   73.3528   3.35277   1.15393         1
       13   2.38103   77.1762   7.17619   2.26703         2
       14   1.13669   73.0157   3.01566         1         3
       15   1.01569   70.4645  0.464485         1         4
       16   2.36641   74.1699   4.16991   1.73009         5
       17   2.27131   73.1005   3.10048   1.79657         6
       18   1.80597   72.6299   2.62986    1.8497         7
       19   2.41142   81.1973   11.1973     2.137         8
       20   1.69218   71.4521   1.45212   1.47894         9
       21   1.95271   74.8427    4.8427   1.93493        10
       22   1.28452   76.7901   6.79008   2.09208        11
       23   1.51663   83.4782   13.4782   1.81162        12
       24   1.34177   73.4237   3.42369   1.57054         1
       25   1.4309    70.7504  0.750369   1.22444         2
       26   1.84851   72.9226   2.92256   2.04468         3
       27   2.08114   78.4248   8.42476   1.78175         4
       28   1.99175   71.0635   1.06346   1.25951         5
       29   2.01235   72.2634    2.2634   1.36943         6
       30   2.38742   74.2037   4.20372   1.82846         7
       31   1.28055   71.2495   1.24953    1.8286         8
       32   2.05698   76.0557   6.05571   2.03548         9
       33   1.05429    77.721   7.72096   1.57831        10
       34   2.15398   70.8861  0.886068    2.1353        11
       35   2.46624   70.9682  0.968163   2.26856        12
       36   1.4406    73.5243   3.52429   1.72608         1
       37   1.71475    71.527   1.52703   1.72932         2
       38   1.51423   78.5824    8.5824   1.97685         3
       39   2.41538   73.7909   3.79093   2.07129         4
       40   2.28402    71.131   1.13101   2.25293         5
       41   1.70251   72.3616   2.36156   2.04926         6
       42   1.19747   72.3894    2.3894         1         7
       43   1.08089   71.1729   1.17288         1         8
       44   2.21695   72.5905   2.59049   1.50915         9
       45   1.52717   71.1402   1.14023   1.88717        10
       46   1.5463    74.6696   4.66958   1.25725        11
       47   2.34151        90        20   3.57864        12
       48   1.10737   71.1989   1.19893   1.62447         1
       49   2.2491    76.6415   6.64147   2.50868         2
       50   1.76659   71.7038   1.70377     1.231         3
       51   1.25174   76.9657   6.96572   1.99521         4
       52   1.81153   73.0722   3.07225   2.15915         5
       53   1.72942   71.9639   1.96392   1.86142         6
       54   2.17748   78.1207   8.12068   2.54388         7
       55   1.29186   77.0589   7.05886   1.82777         8
       56   1.92399   72.6126   2.61256   1.32816         9
       57   1.38008   70.8872  0.887228   1.37826        10
       58   1.96143   73.8529   3.85289   1.87809        11
       59   1.61795   74.6957   4.69565   1.65806        12
       60   2.02756   75.7877   5.78773   1.72684         1
       61   2.41378   75.9826   5.98255   2.76309         2
       62   1.41413   71.3419   1.34194   1.75285         3
       63   2.31185   72.5469   2.54685   2.27947         4
       64   1.94336   71.5592   1.55922   1.96157         5
       65   2.094     74.7338   4.73385   2.07885         6
       66   1.19458    72.233   2.23301         1         7
       67   2.13118   79.1225    9.1225   1.84193         8
       68   1.48076   87.0511   17.0511   2.94927         9
       69   1.98502   79.0913   9.09131   2.47104        10
       70   2.25937   73.8232   3.82322   2.49798        12
       71   1.18744   70.6821  0.682067    1.2848         1
       72   1.20189   70.7053  0.705311   1.33293         2
       73   1.69115   73.9781    3.9781   1.87517         3
       74   1.0556   73.2146   3.21459         1          4
       75   1.59936   71.4165   1.41653   1.29695         5
       76   1.66044   70.7151  0.715145   1.22362         6
       77   1.79167   74.8072   4.80722   1.86081         7
       78   2.30484   71.5028   1.50285   1.60626         8
       79   2.49073   71.5908   1.59084   1.80815         9
       80   1.32729   70.9077  0.907698   1.12889        10
       81   2.48874   83.0079   13.0079   2.59237        11
       82   2.46786   84.1806   14.1806   3.35518        12
       83   2.12407   73.5826   3.58261   1.98482         1
       84   2.46982   76.6556   6.65559   2.48936         2
       85   1.00777   70.2504  0.250364         1         3
       86   1.93118   73.9276   3.92763   1.84407         4
       87   1.00017   72.6359   2.63594    1.3882         5
       88   1.90622    71.047     1.047    1.7595         6
       89   2.43744    72.321   2.32097   1.67244         7
       90   1.25712        90        20   2.63949         8
       91   1.10811   71.8299   1.82987         1         9
       92   2.25545   71.8849    1.8849   1.94247        10
       93   2.47971   73.4697    3.4697   1.87842        11
       94   1.93378   74.2952    4.2952   1.52478        12
       95   2.17525   73.0547   3.05466   2.23563         1
       96   2.18723   70.8299  0.829929   1.75177         2
       97   1.69984   72.0026   2.00263   1.45564         3
       98   1.12504   70.4229  0.422904   1.06042         4
       99   2.41723   73.7324   3.73238   2.18307         5
    ;

    proc iml;

       /*-- Load graphics --*/
       call gstart;


       /*--------------------*/
       /*-- Define modules --*/
       /*--------------------*/

       /*   Module : compute contours   */
       start contour(c,x,y,npoints,pvalues);

       /*   This routine computes contours for a scatter plot         */
       /*   c returns the contours as consecutive pairs of columns    */
       /*   x and y are the x and y coordinates of the points         */
       /*   npoints is the number of points in a contour              */
       /*   pvalues is a column vector of contour probabilities       */
       /*   the number of contours is controlled by the ncol(pvalue)  */


          xx=x||y;
          n=nrow(x);
       /* Correct for the mean */
          mean=xx[+,]/n;
          xx=xx-mean@j(n,1,1);

       /* Find principal axes of ellipses */
          xx=xx` *xx/n;
          call eigen(v,e,xx);

       /* Set contour levels */
          c=-2*log(1-pvalues);
          a=sqrt(c*v[1]); b=sqrt(c*v[2]);

       /* Parameterize the ellipse by angle */
          t=((1:npoints)-{1})#atan(1)#8/(npoints-1);
          s=sin(t);
          t=cos(t);
          s=s` *a;
          t=t` *b;

       /* Form contour points */
          s=((e*(shape(s,1)//shape(t,1)))+mean`@j(1,npoints*ncol(c),1))`;
          c=shape(s,npoints);

       /* Returned as ncol pairs of columns for contours */
       finish contour;
       /*-- Module : draw contour curves --*/
       start gcontour(t1, t2);
          run contour(t12, t1, t2, 30, {.5 .8 .9});
          window=(min(t12[,{1 3}],t1)||min(t12[,{2 4}],t2))//
                 (max(t12[,{1 3}],t1)||max(t12[,{2 4}],t2));
          call gwindow(window);
          call gdraw(t12[,1],t12[,2],,'blue');
          call gdraw(t12[,3],t12[,4],,'blue');
          call gdraw(t12[,5],t12[,6],,'blue');
          call gpoint(t1,t2,,'red');
       finish gcontour;


       /*-- Module : find median, quartiles for box and whisker plot --*/
       start boxwhskr(x, u, q2, m, q1, l);
          rx=rank(x);
          s=x;
          s[rx,]=x;
          n=nrow(x);

       /*-- Median --*/
          m=floor(((n+1)/2)||((n+2)/2));
          m=(s[m,])[+,]/2;

       /*-- Compute quartiles --*/
          q1=floor(((n+3)/4)||((n+6)/4));
          q1=(s[q1,])[+,]/2;
          q2=ceil(((3*n+1)/4)||((3*n-2)/4));
          q2=(s[q2,])[+,]/2;
          h=1.5*(q2-q1);   /*-- step=1.5*(interquartile range) --*/
          u=q2+h;
          l=q1-h;
          u=(u>s)[+,];     /*-- adjacent values -----------------*/
          u=s[u,];
          l=(l>s)[+,];
          l=s[l+1,];

       finish boxwhskr;


       /*-- Box and Whisker plot --*/
       start gbxwhskr(t, ht);
          run boxwhskr(t, up, q2,med, q1, lo);

       /*---Adjust screen viewport and data window  */
          y=min(t)//max(t);
          call gwindow({0, 100} || y);
          mid  = 50;
          wlen = 20;

       /*-- Add whiskers */
          wstart=mid-(wlen/2);
          from=(wstart||up)//(wstart||lo);
          to=((wstart//wstart)+wlen)||from[,2];

       /*-- Add box  */
          len=50;
          wstart=mid-(len/2);
          wstop=wstart+len;
          from=from//(wstart||q2)//(wstart||q1)//
               (wstart||q2)//(wstop||q2);
          to=to//(wstop||q2)//(wstop||q1)//
               (wstart||q1)//(wstop||q1);

       /*---Add median line  */
          from=from//(wstart||med);
          to=to//(wstop||med);

       /*---Attach whiskers to box  */
          from=from//(mid||up)//(mid||lo);
          to=to//(mid||q2)//(mid||q1);

       /*-- Draw box and whiskers  */
          call gdrawl(from, to,,'red');

       /*---Add minimum and maximum data points */
          call gpoint(mid, y ,3,'red');

       /*---Label min, max, and mean  */
          y=med//y;
          s={'med' 'min' 'max'};
          call gset("font","swiss");
          call gset('height',13);
          call gscript(wstop+ht, y, char(y,5,2),,,,,'blue');
          call gstrlen(len, s);
          call gscript(wstart-len-ht,y,s,,,,,'blue');
          call gset('height');
       finish gbxwhskr;


       /*-- Module : do scatter plot matrix --*/
       start gscatmat(data, vname);
          call gopen('scatter');
          nv=ncol(vname);
          if (nv=1) then nv=nrow(vname);
          cellwid=int(90/nv);
          dist=0.1*cellwid;
          width=cellwid-2*dist;
          xstart=int((90 -cellwid * nv)/2) + 5;
          xgrid=((0:nv)#cellwid + xstart)`;


       /*-- Delineate cells --*/
          cell1=xgrid;
          cell1=cell1||(cell1[nv+1]//cell1[nv+1-(0:nv-1)]);
          cell2=j(nv+1, 1, xstart);
          cell2=cell1[,1]||cell2;
          call gdrawl(cell1, cell2);
          call gdrawl(cell1[,{2 1}], cell2[,{2 1}]);
          xstart = xstart + dist;  ystart = xgrid[nv] + dist;

       /*-- Label variables ---*/
          call gset("height", 5);
          call gset("font","swiss");
          call gstrlen(len, vname);
          where=xgrid[1:nv] + (cellwid-len)/2;
          call gscript(where, 0, vname) ;
          len=len[nv-(0:nv-1)];
          where=xgrid[1:nv] + (cellwid-len)/2;
          call gscript(4,where, vname[nv - (0:nv-1)],90);

       /*-- First viewport --*/
          vp=(xstart || ystart)//((xstart || ystart) + width) ;

       /*  Since the characters are scaled to the viewport      */
       /*   (which is inversely porportional to the             */
       /*   number of variables),                               */
       /*   enlarge it proportional to the number of variables  */

          ht=2*nv;
          call gset("height", ht);
          do i=1 to nv;
             do j=1 to i;
                call gportstk(vp);
                if (i=j) then run gbxwhskr(data[,i], ht);
                else run gcontour(data[,j], data[,i]);
          /*-- onto the next viewport --*/
                vp[,1] = vp[,1] + cellwid;
                call gportpop;
             end;
             vp=(xstart // xstart + width) || (vp[,2] - cellwid);
          end;
          call gshow;
    finish gscatmat;

       /*-- Placement of text is based on the character height.       */
       /* The IML modules defined here assume percent as the unit of  */
       /* character height for device independent control.            */
    goptions gunit=pct;

    use factory;
    vname={prod, temp, defect};
    read all var vname into xyz;
    run gscatmat(xyz, vname[1:2]);   /*-- 2 x 2 scatter plot matrix --*/
    run gscatmat(xyz, vname);        /*-- 3 x 3 scatter plot matrix --*/
    quit;

    goptions gunit=cell;             /*-- reset back to default --*/
|
Figure 12.9: ![]() Scatter Plot Matrix
Scatter Plot Matrix
|
Figure 12.10: ![]() Scatter Plot Matrix
Scatter Plot Matrix
Copyright © 2009 by SAS Institute Inc., Cary, NC, USA. All rights reserved.