Context Areas
Right-clicking inside a plot window pops up a context menu, whose contents depend on the location of the mouse pointer when you right-click.
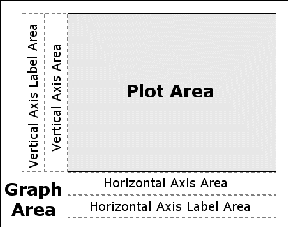
Figure 9.1 shows the six nonoverlapping regions in a two-dimensional plot: the plot area, the graph area, two axis areas, and two axis label areas. An example of a pop-up context menu is shown in Figure 8.1, which shows the context menu for the plot area. The context menus for the other areas in Figure 9.1 look similar; only the first menu item differs among the context menus.
If you right-click in the plot area and select Plot Area Properties, the Plot Area Properties dialog box appears. The dialog box for the plot area controls the appearance of the plot. The tabs on the dialog box vary according to the plot type (histogram, scatter plot, box plot, and so on). Properties that are common to all plots are discussed in this chapter. Plot-specific properties are discussed in Chapter 5, Exploring Data in One Dimension, Chapter 6, Exploring Data in Two Dimensions, Chapter 7, Exploring Data in Three Dimensions, and Chapter 8, Interacting with Plots.
If you right-click in the graph area and select Graph Area Properties (see Figure 9.2), the Graphs Area Properties dialog box appears. You can use the dialog box to change general properties that affect the layout of the plot within the larger graph area. This dialog box is discussed in the section Common Graph Area Properties.

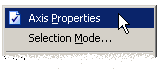
If you right-click in the axis area and select Axis Properties (see Figure 9.3), the Axis Properties dialog box appears. You can use the dialog box to control the scale, font, and placement of tick marks for that axis. Similarly, if you right-click in the axis label area and select Axis Label Properties, the Axis Label Properties dialog box appears. You can use the dialog box to control the font and text used to label that axis. These dialog boxes are discussed in Chapter 10, Axis Properties.
The context areas for a rotating plot are slightly different than shown in Figure 9.1. A rotating plot lacks the "axis area" regions. The rotating plot behaves differently because the position of the axes changes as the plot rotates.