Interaction Tools
The simplest way to interact with plots is by using the mouse to click or drag in the plot. Each plot supports tools that control the way that clicking or dragging affects the plot.
You can see the interaction tools for a plot by right-clicking in a plot. For example, Figure 8.1 shows the tools available for a histogram. Selecting a tool item from the pop-up menu changes the shape of the mouse pointer and determines how the plot interprets a mouse click.
Figure 8.1
Some Available Tools
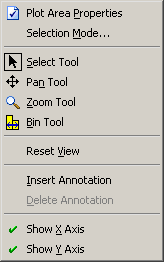
The default tool for all plots is the select tool. The various tools and their effects on the plots are summarized in the following sections.