| Getting Started: Exploratory Data Analysis of Tropical Cyclones |
Creating a Histogram
In this section you create a histogram of the latitude variable and examine relationships between the category and latitude variables. The figures in this section assume that you have excluded observations with low wind speeds as described in the "Creating a Bar Chart" section.
| Select Graph |
The histogram dialog box in Figure 2.6 appears.
| Select the variable latitude, and click Set X. |
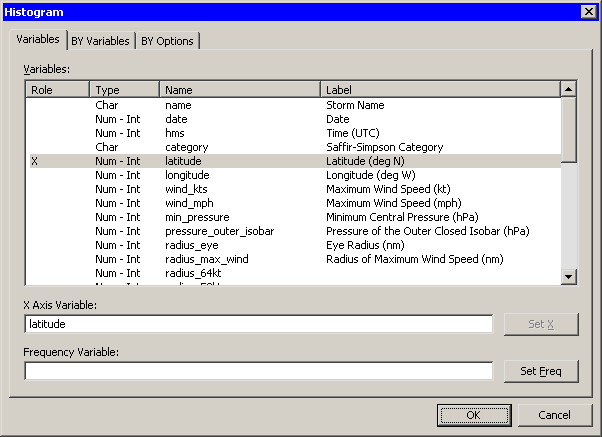 |
Figure 2.6: Histogram Dialog Box
| Click OK. |
A histogram (Figure 2.7) appears, showing the distribution of the latitude variable for the storms that are included in the plots. Move the histogram so that it does not cover the bar chart or data table.
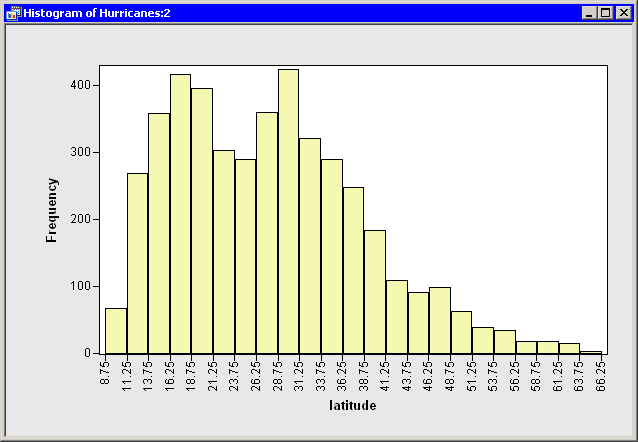 |
Figure 2.7: Histogram of Latitudes of Storms
SAS/IML Studio plots and data tables are collectively known as data views. All data views are dynamically linked, meaning that observations that you select in one data view are displayed as selected in all other views of the same data.
You have seen that you can select observations in a plot by clicking on observation markers. You can add to a set of selected observations by holding the CTRL key and clicking. You can also select observations by using a selection rectangle. To create a selection rectangle, click in a graph and hold down the left mouse button while you move the mouse pointer to a new location.
| Drag out a selection rectangle in the bar chart to select all storms of category 3, 4, and 5. |
The bar chart looks like the one in Figure 2.8.
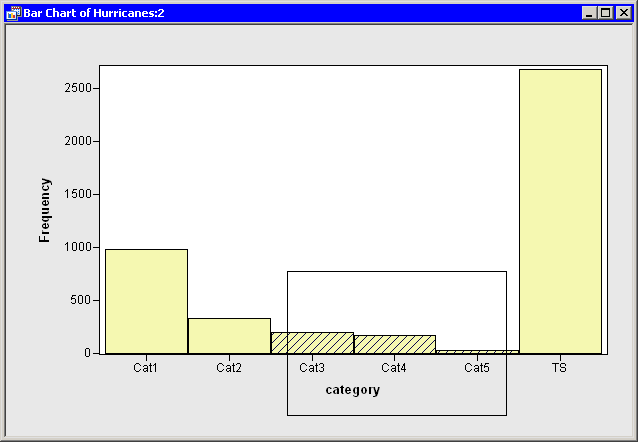 |
Figure 2.8: Selecting the Most Intense Storms
Note that these selected observations are also shown in the histogram in Figure 2.9. The histogram shows the marginal distribution of latitude, given that a storm is greater than or equal to category 3 intensity. The marginal distribution shows that very strong hurricanes tend to occur between 11 and 37 degrees north latitude, with a median latitude of about 22 degrees. If these data are representative of all Atlantic hurricanes, you might conjecture that it would be relatively rare for a category 3 hurricane to strike north of the North Carolina - Virginia border (roughly ![]() north latitude).
north latitude).
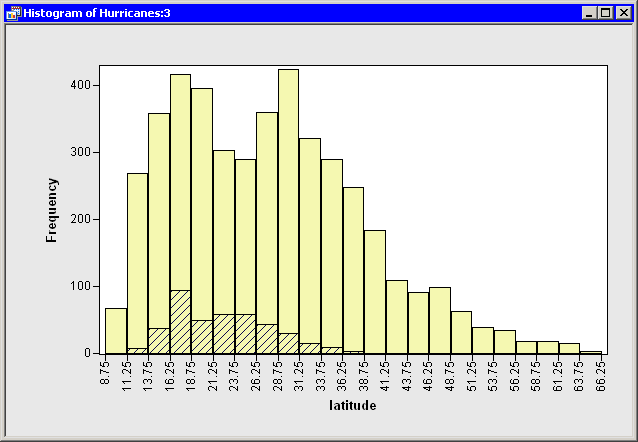 |
Figure 2.9: Latitudes of Intense Storms
Copyright © 2009 by SAS Institute Inc., Cary, NC, USA. All rights reserved.