Overview of Viewing Information Maps

About Information Maps

An information map is a collection of data items and filters that provides a business-specific view of physical data. An information map can be based on either OLAP data (multidimensional data on a SAS server) or relational data (two-dimensional data on a SAS server or in a third-party database).
To view an information map:
  1. Navigate to a portlet that contains an information map, or use the Search tool to find one. Information maps are identified by the information map icon icon.
  2. Click the name of the information map that you want to view. The Visual Data Explorer opens within the portal and displays the information map.
Note: From within the Visual Data Explorer, you can open a different information map or an OLAP cube. For more information, see Opening a Different Data Source.

Overview of the Visual Data Explorer

The Visual Data Explorer provides an easy-to-use interface from which you can view a data source, and customize your view with features such as sorting and filtering.
The Visual Data Explorer displays data on the main Visual Data Explorer page, using tables and graphs.
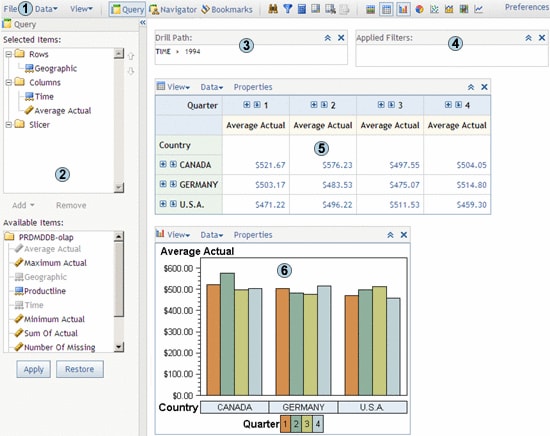
Here is an example data view in the main Visual Data Explorer page:
illustration of the Visual Data Explorer page
The main Visual Data Explorer page can contain the following elements:
1 main menu bar and toolbar
contains file menus and buttons that enable you to manage viewer content, select panels, and open dialog boxes.
2 left panel
displays one of three panels:
Query
enables you to select which data items are used.
Navigator
enables you to drill down on a hierarchy member.
Bookmarks
enables you to manage your bookmarks and data explorations.
3 Drill Path viewer
displays the current navigation path, if you have performed any drill-down actions.
4 Applied Filters viewer
shows any filters that you have applied to the data.
5 table viewer
shows the data as a crosstabulation (OLAP data), or as a table (relational data). The table viewer toolbar contains menus and buttons that enable you to manage the table viewer.
6 graph viewer
displays the data as a graph. There are several types of graphs, and you can display a graph viewer for each type. The graph viewer toolbar contains menus and buttons that enable you to manage the graph viewer.
Note: If your data set is very large (that is, it contains a large number of unique values), the graph viewer might display a message about "insufficient display space." To view the graph, either resize the graph viewer or reduce the size of the data query.

Data Viewing Tasks

From the main Visual Data Explorer page, you can perform the following tasks:
  • Subset your data by drilling down and filtering.
  • Save and restore bookmarked views of your data.
  • Search for data values.
  • Calculate new data items.
  • Export your data view as a SAS report, Microsoft Excel file, or PDF document.
  • View ESRI maps.
  • View the query code.
Note: You cannot use the Visual Data Explorer to make changes to information maps or to physical data.