Text Statement Basics
The ENTRYTITLE, ENTRYFOOTNOTE, and ENTRY statements
add text to predefined areas of the graph. The text that they add
cannot be specified by the options that are available in plot, axis,
legend, or layout statements.
Using Titles and Footnotes
To add titles or footnotes to
a graph, use one or more ENTRYTITLE or ENTRYFOOTNOTE statements. These
statements must appear inside the BEGINGRAPH block, but outside any
layout blocks. The following code shows the typical placement of these
statements:
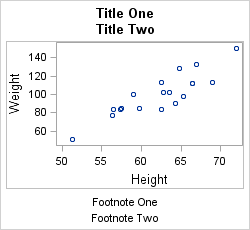
begingraph;
  entrytitle "Title One";
  entrytitle "Title Two";
  layout overlay;
    scatterplot x=height y=weight;
  endlayout;
  entryfootnote "Footnote One";
  entryfootnote "Footnote Two";
endgraph;
begingraph;
  entryfootnote "Footnote One";
  entrytitle "Title One";
  layout overlay;
    scatterplot x=height y=weight;
  endlayout;
  entryfootnote "Footnote Two";
  entrytitle "Title Two";
endgraph;
Note: a light gray border was added
to the graph area to indicate the boundaries between the separate
areas.
Unlike SAS TITLE and
FOOTNOTE statements, the GTL statements are not numbered. If you include
multiple ENTRYTITLE or ENTRYFOOTNOTE statements, the titles or footnotes
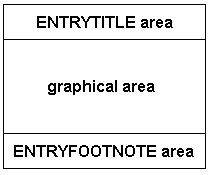
will be stacked in the specified order —all ENTRYTITLE statements
are gathered and placed in the ENTRYTITLE area at the top of the graph,
and all ENTRYFOOTNOTE statements are gathered and placed in the ENTRYFOOTNOTE
area at the bottom of the graph.
You can add as many
titles and footnotes as you want. However, the space that is needed
to accommodate the titles and footnotes always decreases the height
of the graphical area. For graphs with extensive titles or footnotes,
you should consider enlarging the graph size. For a discussion on
sizing graphs, see Controlling Graph Size.
Using Text Entries in the Graphical Area
An ENTRY statement defines
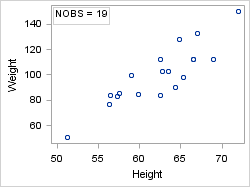
text within the graphical area. Here is a simple example that places
text in the upper left corner of the plot wall area:
layout overlay;
  scatterplot x=height y=weight;
  entry halign=left "NOBS = 19" /
        valign=top border=true;
endlayout;
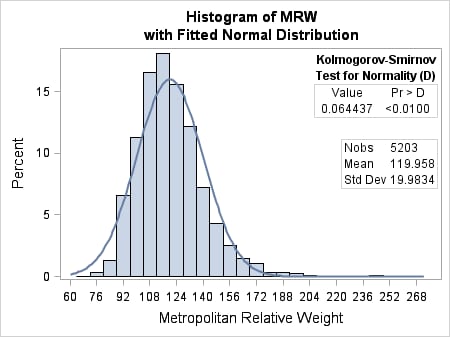
You can use multiple
ENTRY statements in conjunction with GRIDDED layouts to create tables
of text and complex insets.
This example is discussed in detail
in Adding Insets to a Graph.


