The SCATTERPLOTMATRIX
statement provides the following options for displaying insets in
the cells of the graph matrix (see the documentation for the SCATTERPLOTMATRIX
statement in the
SAS Graph Template Language: Reference for complete
details about these options):
|
|
Determines what information
is displayed in an inset. Accepts one, two, or all three of the following
keywords:
Pearson product-moment
correlation
Probability value for
the Pearson product-moment correlation
This option must be used to determine which inset information
is displayed in each cell. If this option is not used, the related
CORROPTS= and INSETOPTS= options are ignored.
|
CORROPTS= ( correlation-options)
|
Controls statistical
options for computing correlations. These options are similar to PROC
CORR options. Accepts one or more of the following keywords:
specifies whether observations
with non-positive weight values are excluded from the analysis. Accepts
TRUE (the default) or FALSE.
specifies whether observations
with missing values are excluded from the analysis that is displayed
in the inset. Accepts TRUE (the default) or FALSE. The NOMISS=TRUE
option does not exclude observations with missing values from the
plot.
specifies a weighting
variable to use in the calculation of Pearson weighted product-moment
correlation. The observations with missing weights are excluded from
the analysis. Accepts the name of a numeric column.
specifies the variance
divisor in the calculation of variances and covariances. Accepts one
of the keywords DF (Degrees of Freedom, the default, N - 1), N (number
of observations), WDF (sum of weights minus 1), WEIGHT (sum of weights).
|
INSETOPTS= ( appearance-options)
|
Controls the inset placement
and other appearance features.
specifies whether the
inset is automatically aligned within the layout. Accepts keywords
NONE (no auto-alignment, the default), AUTO (available only with scatter
plots, attempts to center the inset in the area that is farthest from
any surrounding markers), or a location list in parentheses that contains
one or more keywords that identify the preferred alignment (TOPLEFT
TOP TOPRIGHT LEFT CENTER RIGHT BOTTOMLEFT BOTTOM BOTTOMRIGHT).
specifies the color
of the inset background. Accepts a style reference or a color specification.
specifies whether a
border is displayed around the inset. Accepts TRUE or FALSE (the default).
specifies the horizontal
alignment of the inset. Accepts keywords LEFT (the default), CENTER.
or RIGHT.
specifies whether the
inset background is opaque (TRUE) or transparent (FALSE, the default).
specifies the text
properties of the entire inset.
specifies a title for
the inset.
specifies the text
properties of the inset title.
specifies the vertical
alignment of the inset. Accepts keywords TOP (the default), CENTER.
or BOTTOM.
|
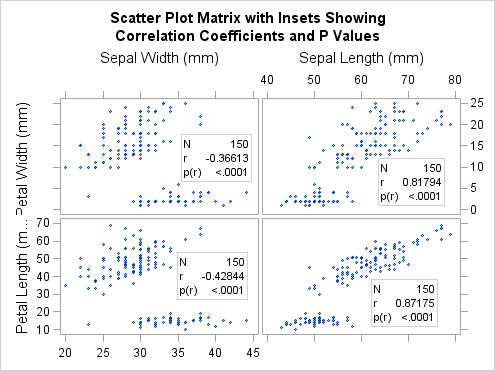
The following example
uses all three of these options to display an inset in the cells of
a graph that is generated with the SCATTERPLOTMATRIX statement:
proc template;
 define statgraph spminset;
   begingraph;
     entrytitle "Scatter Plot Matrix with Insets Showing";
     entrytitle "Correlation Coefficients and P Values";
     layout gridded;
       scatterplotmatrix sepalwidth sepallength /
         rowvars=(petalwidth petallength)
         inset=(nobs pearson pearsonpval)
         insetopts=(autoalign=auto border=true opaque=true)
         corropts=(nomiss=true vardef=df)
         markerattrs=(size=5px);
     endlayout;
   endgraph;
 end;
run;

proc sgrender data=sashelp.iris template=spminset;
run;
Notice that the inset
position might change from cell to cell in order to avoid obscuring
point markers.