Features Supported by Many Plot Statements

Plot Features to Be Displayed
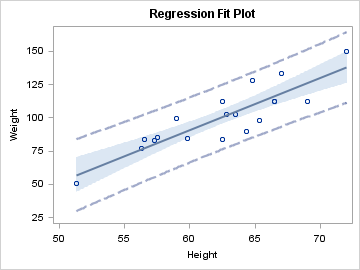
All plots have a standard set of features to display. Most plots can show a different feature set. For example, a HISTOGRAM can display bars that are outlined , filled, or both outlined and filled. A SERIESPLOT displays a line and, if requested, point markers.
DISPLAY=( feature …)
Specifies the plot features to be displayed. Features are plot specific.

Plot Appearance

Depending on the display features, there are options to control the appearance of the features.
MARKERATTRS=( marker-options )
Specifies the symbol, size, color, and weight of markers.
LINEATTRS= ( line-options )
Specifies the pattern, thickness, and color of lines.
TEXTATTRS= ( text-options )
Specifies the text color, font, font size, font weight, and font style.
FILLATTRS= ( fill-options )
Specifies the fill color and transparency.
DATASKIN=(data-skin-name)
Specifies a skin to be applied to filled areas of a plot. See Data Skins.

Plot Transparency

Transparency can be applied to plots that display markers, lines, or filled areas.
DATATRANSPARENCY= number
Specifies the degree of transparency. Default is 0 (fully opaque). 1 is fully transparent.
layout overlay;
  modelband "cli" / display=(outline)
    outlineattrs=GraphPrediction
    datatransparency=.5 ;
  modelband "clm" / display=(fill)
    fillattrs=GraphConfidence
    datatransparency=.5 ;
  scatterplot x=height y=weight /
    primary=true;
  regressionplot x=height y=weight /
    alpha=.05 clm="clm" cli="cli"; endlayout;
Using Transparency in a Graph

Plot Identification

In GTL, legends and some dependent plots (for example, MODELBAND) require a reference (association) with a plot. The association is established by 1) naming the plot, and 2) referring to the plot name within the legend or dependent plot statement.
NAME= "string"
Specifies a unique name for a plot in order to associate it with another statement.
LEGENDLABEL= "string"
Specifies a description of a plot to appear in a legend.
layout overlay;
  modelband "cli" / display=(outline)
    outlineattrs=GraphPrediction
    name="predict"
    legendlabel="95% Prediction Limits" ;
  modelband "clm" / display=(fill)
    fillattrs=GraphConfidence
    name="conf"
    legendlabel="95% Confidence Limits" ;
  scatterplot x=height y=weight /
    primary=true;
  regressionplot x=height y=weight /
    alpha=.05 clm="clm" cli="cli";
  discretelegend "predict" "conf" ;
endlayout;
Associating a Legend with a Plot
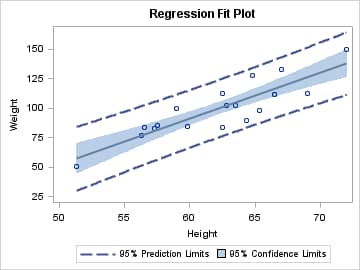
For more information, see Adding Legends to a Graph.

Labels for Plot Features

Most plots have one or more options that enable you to display descriptive labels or data values for points, lines, bars, or bands.
DATALABEL= column
Specifies a column to label data points in a scatter plot, series plot, needle plot, step plot, or vector plot.
DATALABELATTRS= text-properties
Specifies text properties for data labels.
DATALABELPOSITION=TOPRIGHT | TOP | TOPLEFT | LEFT | CENTER | RIGHT | BOTTOMLEFT | BOTTOM | BOTTOMRIGHT
Specifies the position of the data labels relative to the data points.
CURVELABEL= "string" | column | expression
Specifies a string, column, or expression to label one or more lines in a REFERENCELINE, DENSITYPLOT, LINEPARM, REGRESSIONPLOT, LOESSPLOT, PBSPLINEPLOT, SERIESPLOT, or STEPPLOT statement.
CURVELABELUPPER= "string" | column
CURVELABELLOWER= "string" | column
Specifies a string or a string-column to label one or more lines in a BANDPLOT or MODELBAND statement.
CURVELABELATTRS= text-properties
Specifies text properties for curve label(s).
CURVELABELLOCATION= INSIDE | OUTSIDE
Specifies whether the curve label(s) are located inside or outside the plot area.
Note: The CURVELABELLOCATION=OUTSIDE option is not supported in the LATTICE, DATALATTICE, and DATAPANEL layouts.
CURVELABELPOSITION=
Specifies positioning options for the curve label(s).
layout overlay;
  modelband "cli" / display=(outline)
    outlineattrs=GraphPrediction
    curvelabelupper="95% CLI"
    curvelabellower="95% CLI"
    curvelabelattrs=
    (color=GraphPrediction:Contrastcolor)
    curvelabellocation=outside ;
      
  modelband "clm" / display=(fill)
    fillattrs=GraphConfidence
    curvelabelupper="95% CLM"
    curvelabellower="95% CLM"
    curvelabelattrs=
    (color=GraphConfidence:Color)
    curvelabellocation=outside ;
              
  scatterplot x=height y=weight / 
    primary=true datalabel=sex ;

  regressionplot x=height y=weight /
    alpha=.05 clm="clm" cli="cli"
    curvelabel="Fit"
    curvelabelattrs=
    (color=GraphFit:ContrastColor)
    curvelabellocation=outside ;
endlayout;
Using Curve Labels in a Graph
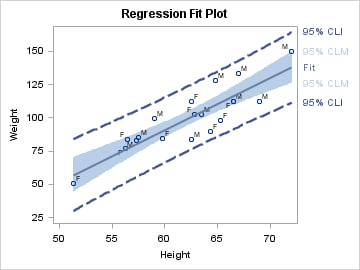
For more information, see Adding and Changing Text in a Graph.

Grouping

Many plots support a GROUP= option, which causes visually different markers, lines, or bands to be displayed for each distinct data value of the specified column. You can vary the appearance of group values with the INDEX= option. You can also use the GROUPDISPLAY= option to change the way groups are displayed.
GROUP= column
Specifies a group column, always treated as having discrete values. For an example use, see the example for Legend Statements.
INDEX= positive-integer-column
Specifies an integer column that associates each distinct data value to a predefined graphical style element GraphData1, GraphData2, …
GROUPDISPLAY=STACK | CLUSTER | OVERLAY
Specifies whether group values for each category are displayed as clusters of bars or as stacked bars for bar charts, or as a cluster of markers or an overlay of markers for other plot types.
For more information about using groups, see Managing Graph Appearance: General Principles.

Axis Assignment

All 2-D plots have four potential axes: X, X2, Y, and Y2. You can choose the axes that any plot uses. Axis options are typically specified on LAYOUT statement containing the plot.
XAXIS= X | X2
Specifies whether the plot's X= column is displayed on the X or X2 axis.
YAXIS= Y | Y2
Specifies whether the plot's Y= column is displayed on the Y or Y2 axis.
For more information, see Managing Axes in an OVERLAY Layout.

Data Tips

Data tips (or tooltips) are text balloons that appear in HTML pages when you move your mouse pointer over a plot component such as a line, marker, or filled area of a graph. To obtain default data tips, simply specify ODS GRAPHICS / IMAGEMAP; as well as the ODS HTML destination. You can customize the data tip information.
ROLENAME= ( role=column …)
Creates additional roles to customize data tips.
TIP= ( role-names )
Specifies which plot roles are used for data tips.
TIPFORMAT=(role=format …)
Specifies a format to be applied to the data for a plot role.
TIPLABEL=( role="string" …)
Specifies a label to be applied to the column for a plot role.
For more information and an example, see Controlling Data Tips.