Data Skins
Data skins add a heightened visual effect to two-dimensional
plots and pie charts that are generated using the GTL. Each skin uses
shading and highlighting to give the appearance of contour and depth
to certain elements of a graph, including the legend. For plots, the
effect is generated by filters and is applied to filled areas such
as bars, bubbles, filled markers, and filled pie chart slices. When
a data skin is applied to a filled area, it does not change the underlying
fill color and pattern of the area, but it does set the area fill
outline color to black. In that case, the outline color is controlled
by the filters that generate the skin and is not controlled by the
ODS style attributes. As a result, when a data skin is applied, the
area fill outline is black regardless of the ODS style that is in
effect or any custom outline attributes that are specified.
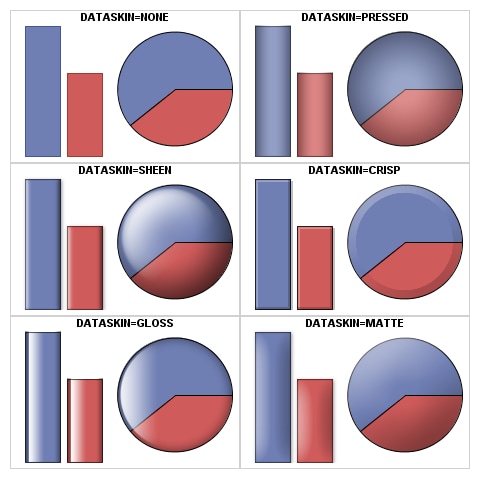
Data skins can be specified
in the following GTL plot statements:
Use the DATASKIN= option in the plot
statement to specify the skin as NONE, SHEEN, GLOSS, PRESSED, CRISP,
or MATTE.
| BARCHART | PIECHART |
| BARCHARTPARM | SCATTERPLOT |
| BUBBLEPLOT | WATERFALLCHART |