Controlling the Interactions of Classifiers
Whenever you have classifiers with a large number
of unique levels, the potential exists for generating a large number
of cells in the panel. If you do not want to see all classification
levels, you can limit the crossings by using a WHERE expression when
creating the input data. Or, you can use a WHERE expression as part
of the PROC SGRENDER step that renders the graph.
Appearance of the Last Panel
If you set the ROWS=
and COLUMNS= options to define a relatively small grid, PROC SGRENDER
automatically generates as many separate panels as it takes to exhaust
all the classification levels. Depending on the grid size and total
number of classification levels, one or more empty cells might be
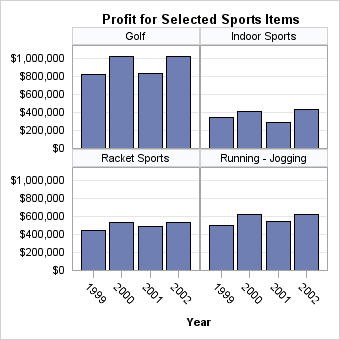
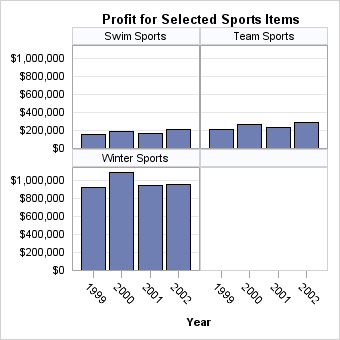
created on the last panel to complete the grid. For example, if there
are seven classification levels and you define a 2x2 grid, two panels
are created (with different names), and the last panel contains one
empty cell:
layout datapanel classvars=(product_category) /
    rows=2 columns=2
    headerlabeldisplay=value
    rowaxisopts=(griddisplay=on offsetmin=0
    display=(tickvalues) linearopts=(tickvalueformat=dollar12.));
  layout prototype;
    barchart x=year y=profit / fillattrs=GraphData1;
  endlayout;
  sidebar / align=top;
    entry  "Profit for Selected Sports Items" /
      textattrs=GraphTitleText;
  endsidebar;
endlayout;
layout datapanel classvars=(product_category) /
    rows=2 columns=2
    skipemptycells=true
    headerlabeldisplay=value
    rowaxisopts=(griddisplay=on offsetmin=0
    display=(tickvalues) linearopts=(tickvalueformat=dollar12.));
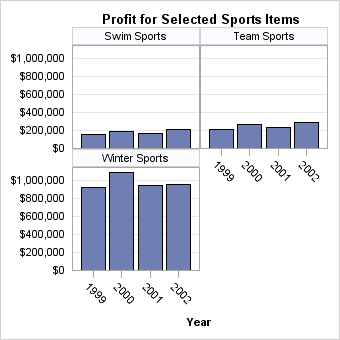
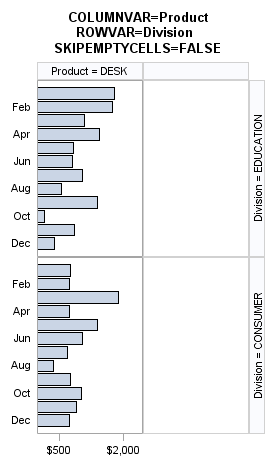
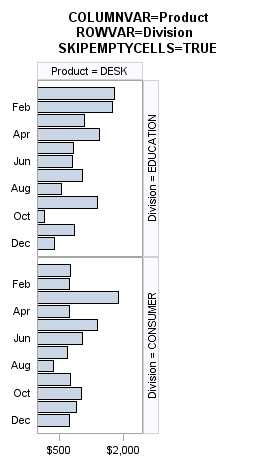
The SKIPEMPTYCELLS=
option also applies to a DATALATTICE layout. The following output
shows the last panel when Division has two levels and Product has
three levels, while ROWS=2 and COLUMNS=2. When SKIPEMPTYCELLS=FALSE,
the last panel will have a column of empty cells. Entire rows or columns
of empty cells can be removed by setting SKIPEMPTYCELLS=TRUE.
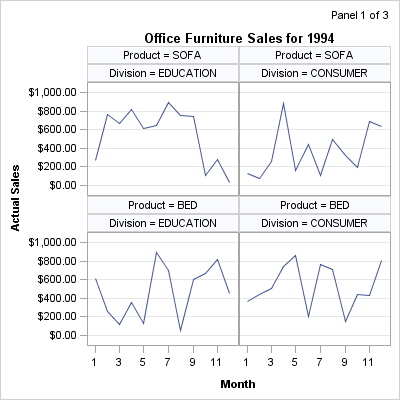
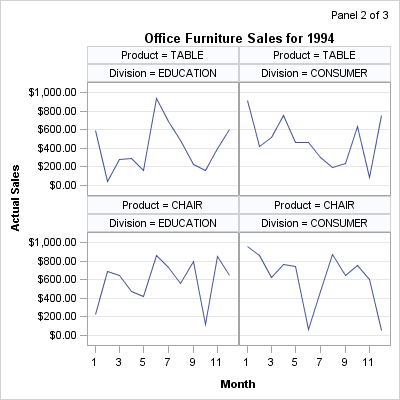
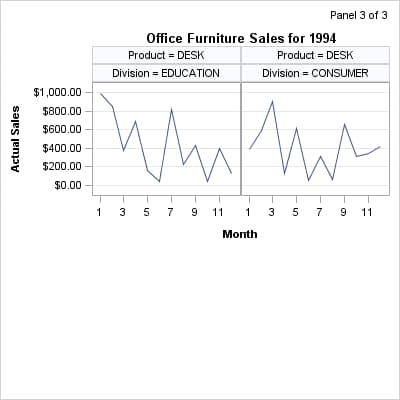
User Control of Panel Generation
It is possible to control
the generation of panels. Consider the following output, in which
each panel displays in its upper right corner the current panel number
and the total number of panels:
Normally, when the number of cells to be created in a
panel is greater than the defined panel size in the template (rows
* columns), then the SGRENDER procedure automatically produces the
number of panel graphs that are necessary to draw all of the cells
in the data. However, you can instruct the template to create only
one panel, which is specified by the PANELNUMBER= option. This feature
can be used to control the creation of the panels.
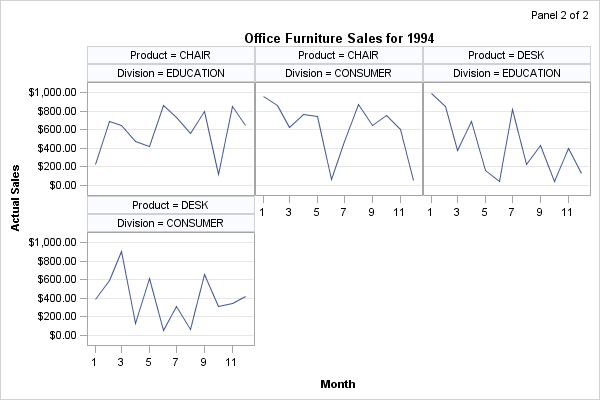
For example, the preceding
panels were generated with the following template code, which uses
the NMVAR statement to declare macro variables that will resolve as
numbers. The PANELNUMBER=PANELNUM setting is a directive indicating
which panel to produce. The ENTRYTITLE statement changes as the panel
number changes. For more information about how to pass information
to a template at run time, see Using Dynamics and Macro Variables to Make Flexible Templates.
proc template;
define statgraph panelgen;
  nmvar PANELNUM TOTPANELS ROWS COLS YEAR;
  begingraph;
    entrytitle halign=right "Panel " PANELNUM " of " TOTPANELS /
        textattrs=GraphFootnoteText;
    layout datapanel classvars=(product division) /
        rows=ROWS columns=COLS
        cellheightmin=50 cellwidthmin=50
        skipemptycells=true
        columnaxisopts=(type=time timeopts=(tickvalueformat=month.))
        rowaxisopts=(griddisplay=on)
        panelnumber=PANELNUM;
      layout prototype;
        seriesplot x=month y=actual / lineattrs=GraphData1;
      endlayout;
      sidebar / align=top;
        entry "Office Furniture Sales for " YEAR /
          textattrs=GraphTitleText;
      endsidebar;
    endlayout;
  endgraph;
end;
run;
Now that the template
is defined, a macro is needed to compute the number of panels that
will be generated, execute PROC SGRENDER an appropriate number of
times, and initialize the macro variables that are referenced in the
template. The macro parameters ROWS and COLUMNS allow different grid
sizes to be used. The graph size changes based on the grid size.
%macro panels(rows=1,cols=1,year=1994);
  %local div_vals prod_vals panels totpanels panelnumber;

  /* find the number of unique values for the classifiers */
  proc sql noprint;
    select n(distinct division) into: div_vals from sashelp.prdsale;
    select n(distinct product) into: prod_vals from sashelp.prdsale;
  quit;

  /* compute the number of panels based on input rows and cols */
  %let panels=%sysevalf(&div_vals * &prod_vals / (&rows * &cols));
  %let totpanels=%sysfunc(ceil(&panels)); /* round up to next integer */

  ods graphics / reset ;
  ods html close;
  ods listing style=listing gpath="." image_dpi=200;

  %do panelnum=1 %to &totpanels;

    ods graphics / imagename="Panel&panelnum"
      width=%sysevalf(200*&cols)px height=%sysevalf(200*&rows)px;

    proc sgrender data=sashelp.prdsale template=panelgen;
      where country="U.S.A." and region="EAST" and year=&year;
    run;

  %end;

  ods listing close;
  ods html;
%mend;
The three panels that
are shown at the beginning of this section were produced with the
following macro call:
%panels(rows=2,cols=2)
Sparse Data
Multiple classifiers
sometimes have a hierarchical relationship, which results in very
sparse data when the classifier values are crossed. For example, consider
the following LAYOUT DATAPANEL statement:
layout datapanel classvars=(state city) / rows=4 columns=5;
Assume that the data
for the STATE and CITY classifiers contains information for 20 states
and their capitals. How many panels would you expect to produce?
One, or twenty? Or 400?
The answer is one panel,
which is the desired result. A single panel is produced because even
though the default DATAPANEL layout attempts to generate a complete
Cartesian product of the crossing values (400 STATE*CITY crossings
in this case), it does not create panel cells for crossings that have
no data. The SPARSE= option controls whether panel cells are created
when you have no observations for a crossing, and by default SPARSE=FALSE.
The DATALATTICE layout
does not support a SPARSE= option. The DATALATTICE creates a row
/ column for each unique value of the ROWVAR / COLUMNVAR. So a cell
is created for all crossings of the two variable values, thus creating
400 cells.
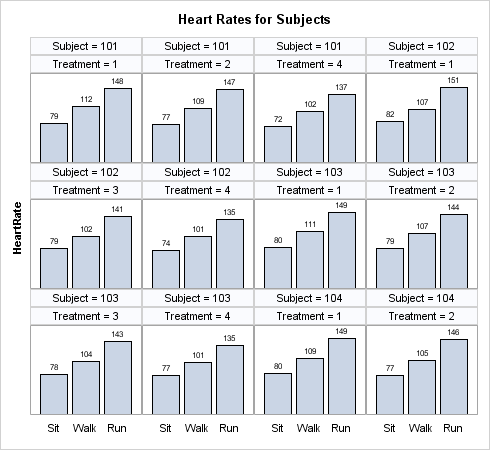
Sometimes there are
unexpected gaps in the data when classification variables are crossed.
For example, suppose you are conducting a study where a number of
subjects each receives over time four treatments that might lower
the subject's heart rate after various amounts of physical activity.
However, assume that Subject 101 did not get Treatment 3, and Subject
102 did not get Treatment 2. In this case, when you create a DATAPANEL
layout presenting four treatments for three subjects per panel, the
expected alignment of the columns does not work:
In this situation, you
can generate a placeholder cell whenever a subject misses a treatment.
To do so, specify SPARSE=TRUE for the layout panel.
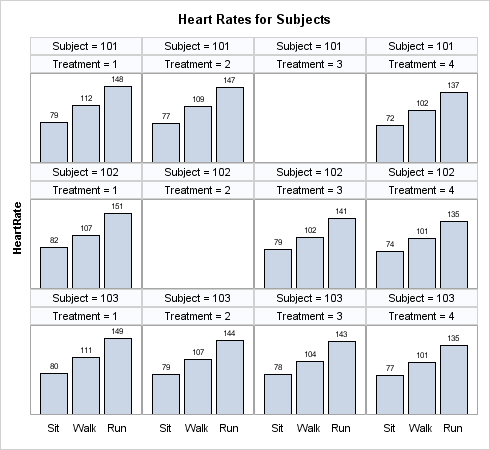
proc template;
 define statgraph sparse;
  begingraph / designwidth=490px designheight=450px;
    entrytitle  "Heart Rates for Subjects";
    layout datapanel classvars=(subject treatment) /
        columns=4 rows=3
        cellheightmin=50 cellwidthmin=50
        skipemptycells=true
        sparse=true
        columnaxisopts=(display=(tickvalues))
        rowaxisopts=(display=(label) offsetmin=0);
      layout prototype;
        barchart x=task y=heartrate / barlabel=true;
      endlayout;
    endlayout;
  endgraph;
 end;
run;
The SPARSE= option does
not apply to DATALATTICE layouts because they are inherently sparse.
When you specify two classifiers, the DATALATTICE layout manages this
situation automatically.
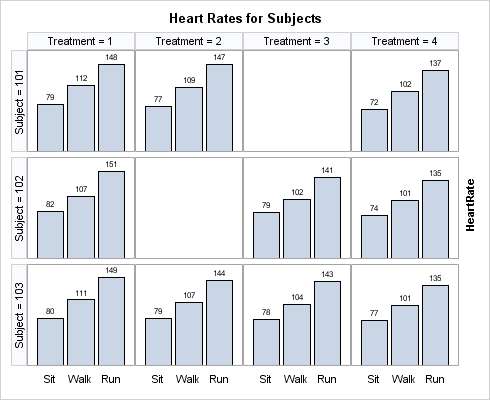
proc template;
 define statgraph datalattice;
  begingraph / designwidth=490px designheight=400px;
    entrytitle  "Heart Rates for Subjects";
    layout datalattice rowvar=subject columnvar=treatment /
        rows=3  rowgutter=5px
        cellheightmin=50 cellwidthmin=50
        rowheaders=left
        skipemptycells=true
        columnaxisopts=(display=(tickvalues))
        rowaxisopts=(display=none displaysecondary=(label) offsetmin=0);
      layout prototype;
        barchart x=task y=heartrate / barlabel=true;
      endlayout;
    endlayout;
  endgraph;
 end;
run;
Missing Values
By
default, missing class values are included in the classification levels
for the panel. When the data contains missing classification values,
cells are created in the panel for the missing classes. The classification
headers for the missing values are either blank for missing string
values or a dot for missing numeric values. You can use the INCLUDEMISSINGCLASS=FALSE
option to ignore the missing values. If you prefer to keep the missing
values, you can create a format that specifies more meaningful headings
for the missing classes. Here is an example that creates a format
for missing product name and branch number classes.