Defining a Basic Grid
Although you can generate a nice looking graph in
a default GRIDDED layout, in most cases you will want more control
over the grid, how it is populated, and the complexity of the cell
contents.
Setting Grid Dimensions
Assume you want a grid
of five plots. Before starting to write code, you must first decide
what grid dimensions you want to set (how many columns and rows) and
whether you want to permit an empty cell in the grid. If do not want
an empty cell, you must limit the grid to five cells, which gives
you two choices for the grid dimensions: five columns by one row (5x1),
or one column by five rows (1x5).
To specify the grid
size, you use the COLUMNS= or ROWS= option in the LAYOUT GRIDDED statement.
To use ROWS=, you must also specify ORDER=COLUMNMAJOR.
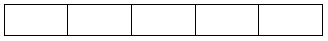
Two explicit specifications
could be used to create the following grid, which contains one row
and five columns:
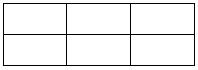
If you are willing to have an
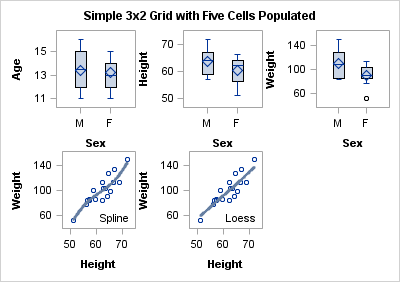
empty cell in the grid, you could use a 2x3 or a 3x2 grid:
layout gridded / columns=3 ;
endlayout;
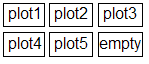
By default, the layout
uses the ORDER=ROWMAJOR setting to populate grid cells. This specification
essentially means "fill in all cells in the top row (starting at the
top left) and then continue to the next row below." COLUMNS=1 by default
when ORDER=ROWMAJOR, so you must specify an alternative setting to
increase the number of columns in the grid:
layout gridded / columns=3 ;
  /* plot1 definition */
  /* plot2 definition */
  /* plot3 definition */
  /* plot4 definition */
  /* plot5 definition */
endlayout;
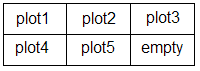
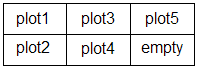
Alternatively, you can
specify ORDER=COLUMNMAJOR, which means "fill in all cells in the left
column and then continue to the next column to the right." ROWS=1
by default when ORDER=COLUMNMAJOR, so you must specify an alternative
setting to increase the number of rows in the grid:
layout lattice / rows=2 order=columnmajor ;
  /* plot1 definition */
  /* plot2 definition */
  /* plot3 definition */
  /* plot4 definition */
  /* plot5 definition */
endlayout;
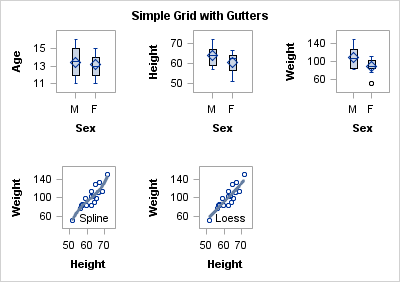
Setting Gutters
To conserve space, the default GRIDDED layout does not
include a gap between cell boundaries. In some cases, this might cause
the cell contents to appear too congested. You can add a vertical
gap between all cells with the COLUMNGUTTER= option, and you can add
a horizontal gap between all rows with the ROWGUTTER= option. If
no units are specified, pixels (PX) are assumed.
layout gridded / columns=3 columngutter=5 rowgutter=5 ;
  /* plot1 definition */
  /* plot2 definition */
  /* plot3 definition */
  /* plot4 definition */
  /* plot5 definition */
endlayout;
Note that by adding
gutters, you do not increase the size of the graph. Instead, the cells
shrink to accommodate the gutters. Depending on the number of cells
in the grid and the size of the gutters, you will frequently want
to adjust the size of the graph to obtain optimal results, especially
if the cells contain complex graphs. For more information, see Sizing Issues.
Defining Cells
entrytitle "Simple 3x2 Lattice with Five Cells Populated";

layout gridded / columns=3;

  /* stand-alone plot statements define cells 1-3 */
  boxplot x=sex y=age;
  boxplot x=sex y=height;
  boxplot x=sex y=weight;

  /* overlay blocks define cells 4-5 */
  layout overlay;
    scatterplot y=weight x=height;
    pbsplineplot y=weight x=height;
    entry halign=right "Spline" / valign=bottom;
  endlayout;

  layout overlay;
    scatterplot y=weight x=height;
    loessplot y=weight x=height;
    entry halign=right "Loess " / valign=bottom;
  endlayout;

endlayout;