The LAYOUT GRIDDED Statement
The GTL provides several
layout types to organize your graph into smaller regions (cells).
The GRIDDED and LATTICE layouts support a regular grid of cells
with a fixed number of rows and columns. The DATALATTICE and DATAPANEL
layouts generate classification panels, which are graphs where the
number of cells and the cell content are determined by the values
of one or more classification variables.
The GRIDDED layout differs
from the classification panel layouts in that the number of cells
must be predefined and that you must define of the content of each
cell separately. GRIDDED is superficially similar to a LATTICE layout
because it can create a grid of heterogeneous plots. However, the
LATTICE layout can automatically align plot areas across columns and
rows and has much more functionality. For more information about the
LATTICE layout, see Using an Advanced Multi-cell Layout.
Typical applications
of GRIDDED layouts are to create:
-
a table of text, such as an inset (discussed in detail in Adding Insets to a Graph)
In a GRIDDED layout,
each cell is independent. Contents of the cell can be specified by
a stand-alone plot statement or a nested layout. The following example
shows a very simple GRIDDED layout:
proc template;
  define statgraph intro;
    begingraph;
      entrytitle "Two-Cell Gridded Layout";
      layout gridded;
        barchart x=age;
        scatterplot x=height y=weight;
      endlayout;
    endgraph;
  end;
run;

proc sgrender data=sashelp.class template=intro;
run;
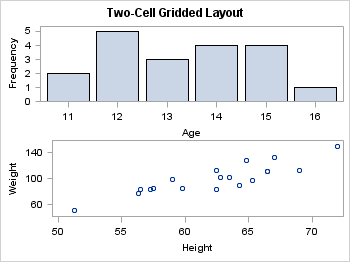
In this case, each plot
statement is considered independent and is placed in a separate cell.
When no grid size is provided, the default layout creates a graph
with one column of cells, and it allots each cell the same amount
of space. The number of rows in the grid is determined by the number
and arrangement of stand-alone plot statements and nested layouts
in the GRIDDED layout block.