Building a Table of Text
Using a Single Layout
One of the most common
applications of the GRIDDED layout is to build a table of text or
statistics using nested ENTRY statements.
layout gridded / columns=2 order=rowmajor
                 border=true columngutter=5px;
  /* row 1 */
  entry halign=left "N";
  entry halign=left "5203";
  /* row 2 */
  entry halign=left "Mean";
  entry halign=left "119.96";
  /* row 3 */
  entry halign=left "Std Dev";
  entry halign=left "19.98";
endlayout;

Tables like this can
be organized many different ways. For more information about these
techniques, see Adding and Changing Text in a Graph for details
about ENTRY statements, and see Adding Insets to a Graph for details
about defining the tables.
Using Nested Layouts
When GRIDDED layouts
are used to create tables of text, the tables often appear within
another layout. For example, the table might be used within the plot
wall of an OVERLAY layout, or within a SIDEBAR block of a LATTICE
layout. When the table is used within a LAYOUT OVERLAY, it is often
necessary to position the table so that it avoids collision with the
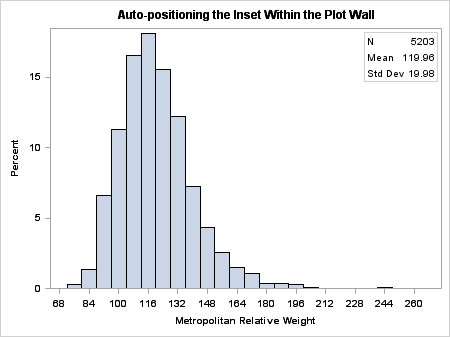
plot. In the following example, the AUTOALIGN=(position-list) option of the GRIDDED layout is
used to dynamically position the table in the TOPRIGHT or TOPLEFT
position. TOPRIGHT is tried first, but TOPLEFT is used if the TOPRIGHT
position would cause the histogram to collide with the table.
proc template;
define statgraph inset2;
  begingraph;
    entrytitle "Auto-positioning the Inset Within the Plot Wall";
    layout overlay;
      histogram mrw;
      layout gridded / columns=1 border=true
                       columngutter=5px
                       autoalign=(topright topleft);
        entry  halign=left "N"       halign=right "5203";
        entry  halign=left "Mean"    halign=right "119.96";
        entry  halign=left "Std Dev" halign=right "19.98";
      endlayout;
    endlayout;
  endgraph;
end;
run;

proc sgrender data=sashelp.heart template=inset2;
run;
In this example, the
values for the statistics in the table are hardcoded. Obviously, you
would prefer that the statistics values be calculated in the template. Adding Insets to a Graph shows how these values can be computed
in the template or passed to the template using dynamic or macro variables.