Example: Combine Multiple SG Attribute Maps in a Graph
This example uses an
SG attribute map data set that contains two attribute maps. Here are
the noteworthy characteristics of the attribute map data set and the
procedure:
-
In the procedure, the plot statements specify different ATTRID= values in order to use the different attribute maps. The plot statements also specify different GROUP= values. (A group variable can be associated with only one attribute map ID. For more information, see Data Sets That Contain Multiple SG Attribute Maps.)
Here is the SAS code
that creates the attribute map data set and uses the SGPLOT procedure
to generate the graph.
This DATA step creates
the data that is used for the graph. The STATE and the TYPE variables
are used in the procedure to group the data.
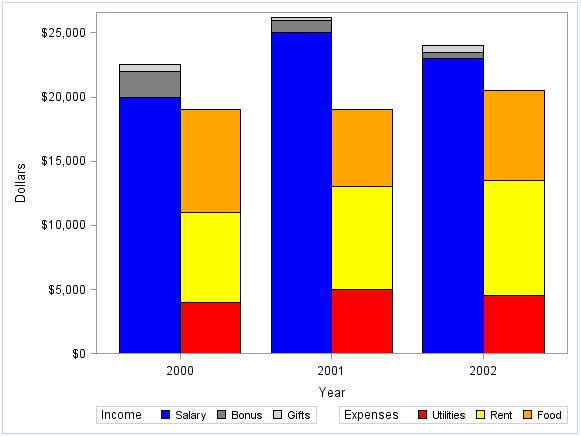
data finances;
format income dollar8. expense dollar8.;
length expensetype $ 9;
input Year incometype $ income expensetype $ expense;
datalines;
2000 Salary 20000 Utilities 4000
2000 Bonus   2000 Rent      7000
2000 Gifts    500 Food      8000
2001 Salary 25000 Utilities 5000
2001 Bonus   1000 Rent      8000
2001 Gifts    200 Food      6000
2002 Salary 23000 Utilities 4500
2002 Bonus    500 Rent      9000
2002 Gifts    500 Food      7000
;
run;
This DATA step creates
the SG attribute map data set. The data set contains two attribute
maps. Each attribute map is specified by an ID value: INCOME or EXPENSE.
data attrmap;
length value $ 9 fillcolor $ 9;
retain linecolor "black";
input id $ value $ fillcolor $;
datalines;
income  Salary    blue
income  Bonus     gray
income  Gifts     lightgray
expense Utilities red
expense Rent      yellow
expense Food      orange
;
run;
This PROC step generates
the graph. The SGPLOT statement references the FINANCES data set and
the ATTRMAP attribute map data set. Each plot statement references
an attribute map ID. The plot statements also specify different GROUP=
values.
proc sgplot data=finances dattrmap=attrmap;
yaxis label="Dollars";
vbarparm category=year response=income / group=incometype attrid=income
         barwidth=0.4 groupdisplay=stack
         discreteoffset=-0.2 name="income";
vbarparm category=year response=expense / group=expensetype attrid=expense
         barwidth=0.4 groupdisplay=stack
         discreteoffset=0.2 name="expense";
keylegend "income" / position=bottomleft title="Income";
keylegend "expense" / position=bottomright title="Expenses";
run;