SG Attribute Map Data Sets
About the SG Attribute Map Data Set
Attribute map data sets
are used in the SG procedures to associate data values with visual
attributes.
When you have determined
which attributes you want to apply to the group data in a graph, you
can create an SG attribute map data set. Each observation defines
the attributes for a particular data group. An observation uses reserved
variable names for the attribute map identifier (ID), the group value
(VALUE), and the attributes.
You create the data
set using the same methods that you use to create any SAS data set.
The main distinctions are that the SG attribute map data set uses
reserved keywords for its variable names, and each observation represents
the attributes for a particular data group. The most commonly used
method for creating data sets is with a DATA step. For more information
about the DATA step, see SAS Language Reference: Concepts.
Note: Incorrect data in the attribute
map data set can cause the graph to fail. For example, truncated variable
values caused by the incorrect variable length being specified results
in incorrect data.
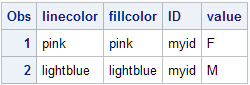
Here is an example
of an SG attribute map data set called MYATTRMAP. The observations
in this data set contain the attribute map identifier (ID), the group
value (VALUE), and the attributes (LINECOLOR, FILLCOLOR).
Listing of the SG Attribute Map Data Set MYATTRMAP
-
The values for LINECOLOR= and FILLCOLOR= are valid SAS colors. You can specify colors using the same color schemes that are supported by
SAS/GRAPH software. For more information, see Color-Naming Schemes in SAS/GRAPH: Reference.
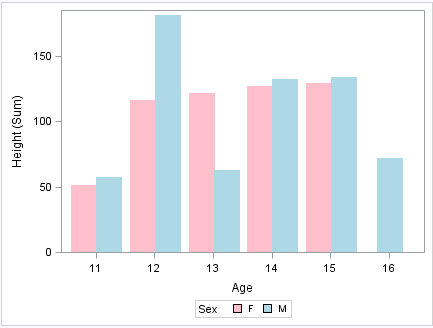
The following output
shows a bar chart that uses the MYATTRMAP data set for its pink and
blue bar colors. The FILLCOLOR= values determine the color of the
bars, and the LINECOLOR= values determine the color of the border
edges around the bars.
The chart was produced
with the SGPLOT procedure. The name of the data set is referenced
in the procedure statement.
This DATA step creates
the SG attribute map data set MYATTRMAP. The ID values for the attribute
map are MYID.
data myattrmap;
length linecolor $ 9 fillcolor $ 9;
input ID $ value $ linecolor $ fillcolor $;
datalines;
myid  F pink pink
myid  M lightblue lightblue
;
run;
This procedure generates
the graph. The SGPLOT statement references the SASHELP.CLASS data
set and the ATTRMAP attribute map data set. The plot statement references
the attribute map ID (MYID). The options that reference the attribute
map (data set and ID) are highlighted.
proc sgplot data=sashelp.class dattrmap=myattrmap;
vbar age / response=height group=sex groupdisplay=cluster attrid=myid;
run;
For more information
about the highlighted options that are used in the procedure, see Modify the Procedure to Use the SG Attribute Map Data Set.
You use a standard syntax
to specify colors, line thickness, line patterns, and marker symbols.
For more information about this syntax, see the following topics:
-
Specifying Colors in SAS/GRAPH Programs in SAS/GRAPH: Reference
Data Sets That Contain Multiple SG Attribute Maps
An SG attribute map
data set can contain more than one attribute map. This capability
enables you to apply different attribute maps to different group variables
in a graph.
In the procedure that
generates the graph, the plot statements can specify different attribute
map ID values.
Note: Plots that specify different
ID values must also specify different groups. A group variable can
be associated with only one attribute map ID. If a group is associated
with more than one attribute map ID value, the graph produces incorrect
attribute mapping and a warning is written to the SAS log.
For an example, see Example: Combine Multiple SG Attribute Maps in a Graph.
Reserved SG Attribute Map Variables
About the Reserved SG Attribute Map Variables
When an SG attribute
map data set is processed, the SG procedure looks at the values of
specific variables in the SG attribute map data set. The procedure
uses these values to associate visual attributes with group data.
Variables in the SG attribute map data set have predefined names.
In each observation, the procedure looks only for variables with those
names. Other variables can be present, but they are ignored.
Variables That Have Style Values
For more information
about style elements, see Style Elements for Use with ODS Graphics.
For a table of the style
elements and attributes that you can use with ODS Statistical Graphics,
see Style Elements Affecting Template-Based Graphics in SAS Output Delivery System: User's Guide. This table contains each style element, the portion of the graph
that it affects, and the default attribute values.
Descriptions of the Reserved Variables
- FILLCOLOR= “color” | “style-attribute”
-
specifies the fill color. You can specify colors using the same color schemes that are supported by
SAS/GRAPH software. For more information, see Color-Naming Schemes in SAS/GRAPH: Reference.
- FILLSTYLE= “style-element”
-
specifies the style element for fill attributes. If you specify the style element, you can also specify the FILLCOLOR variable to override the color.
- ID= “text-string”
-
(required) specifies the ID of the attribute map. This value is referenced from the ATTRID option on one or more plot statements.
- LINECOLOR= “color” | “style-attribute”
-
specifies the color of the line. You can specify colors using the same color schemes that are supported by
SAS/GRAPH software. For more information, see Color-Naming Schemes in SAS/GRAPH: Reference.
- LINEPATTERN= “line-pattern” | “style-attribute”
-
specifies a line pattern for lines and outlines. You can reference SAS patterns by number or by name. For a list of line patterns, see Line Patterns.
- LINESTYLE= “style-element”
-
specifies the style element for line attributes. If you specify the style element, you can also specify the LINEPATTERN and LINECOLOR variables to override specific appearance attributes.
- MARKERCOLOR= “color” | “style-attribute”
-
specifies the color for the markers. You can specify colors using the same color schemes that are supported by
SAS/GRAPH software. For more information, see Color-Naming Schemes in SAS/GRAPH: Reference.
- MARKERSTYLE= “style-element”
-
specifies the style element for marker attributes. If you specify the style element, you can also specify the MARKERSYMBOL and MARKERCOLOR variables to override specific appearance attributes.
- MARKERSYMBOL= “symbol-name” | “style-attribute”
-
specifies the symbol for the markers. For a list of valid marker symbols, see Marker Symbols.
- VALUE= “text-string”
-
(required) specifies the group data value that is assigned to the attributes. The value must be valid for the data group that is assigned in the plot statement with the GROUP= option. You can provide different values in the data set if your plots specify different group variables.Note:The value is case sensitive. Each instance of the value must have the exact same capitalization.