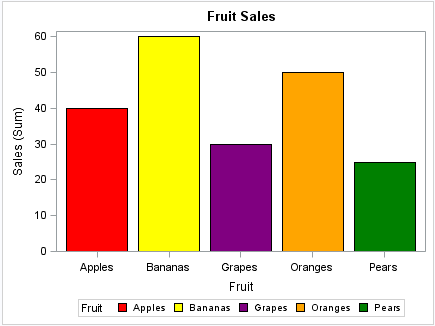
Example: Create a Plot That Uses a Single SG Attribute Map
Here is the SAS code
that creates the input data set, the attribute map data set, and the
SGPLOT procedure output.
This DATA step creates
the data that is used for the graph. The FRUIT variable is used in
the procedure to group the data.
data fruit_sales;
input Fruit $ Sales;
datalines;
Apples   40
Pears    25
Oranges  50
Grapes   30
Bananas  60
run;
This DATA step creates
the SG attribute map data set. The data set contains one attribute
map, which is specified by the ID variable. All ID values for the
attribute map are FRUIT.
data attrmapfruit;
retain linecolor "black";
input id $ value $ fillcolor $;
datalines;
fruit Apples  red
fruit Pears   green
fruit Oranges orange
fruit Grapes  purple
fruit Bananas yellow
;
run;
This PROC step generates
the graph. The SGPLOT statement references the FRUIT_SALES data set
and the ATTRMAPFRUIT attribute map data set. The plot statement references
the attribute map ID (FRUIT).
title  "Fruit Sales";
proc sgplot data=fruit_sales dattrmap=attrmapfruit;
vbar Fruit / response=Sales group=Fruit attrid=fruit;
run;
title;