Example Program and Statement Details

Example Graph

The following graph was generated by the Example Program:
Example Step Plot

Example Program

proc template;
  define statgraph stepplot;
    begingraph;
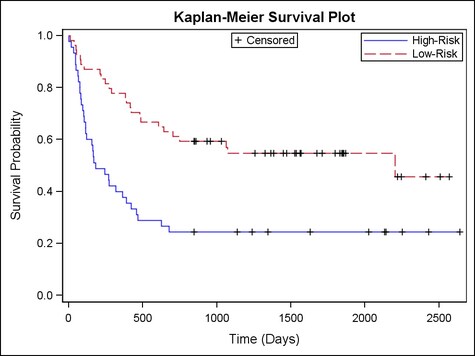
      entrytitle "Kaplan-Meier Survival Plot";
      layout overlay /
        yaxisopts=(linearopts=(viewmin=0 viewmax=1));
        stepplot x=Time y=Survival /
          group=Stratum name="step";
        scatterplot x=Time y=Censored /  name="scat"
          legendlabel="Censored" markerattrs=(symbol=plus);
        discretelegend "step" / location=inside
          halign=right valign=top across=1;
        discretelegend "scat" /
          location=inside halign=center valign=top;
       endlayout;
    endgraph;
  end;
run;

data Study;
input Group : $10. Time Status @@;
label Time="Time (Days)";
datalines;

 ... [datalines shown below]

run;

ods graphics;
ods exclude all;
ods output survivalplot=plotdata;
proc lifetest data=Study plots=(survival);
   time Time * Status(0);
   survival;
   strata Group;
run;
ods select all;

proc sgrender data=plotdata template=stepplot;
run;
Here are the data lines for the example program:
Low-Risk  2569 0 Low-Risk  2506 0 Low-Risk  2409 0
Low-Risk  2218 0 Low-Risk  1857 0 Low-Risk  1829 0
Low-Risk  1562 0 Low-Risk  1470 0 Low-Risk  1363 0
Low-Risk  1030 0 Low-Risk   860 0 Low-Risk  1258 0
Low-Risk  2246 0 Low-Risk  1870 0 Low-Risk  1799 0
Low-Risk  1709 0 Low-Risk  1674 0 Low-Risk  1568 0
Low-Risk  1527 0 Low-Risk  1324 0 Low-Risk   957 0
Low-Risk   932 0 Low-Risk   847 0 Low-Risk   848 0
Low-Risk  1850 0 Low-Risk  1843 0 Low-Risk  1535 0
Low-Risk  1447 0 Low-Risk  1384 0 Low-Risk   414 1
Low-Risk  2204 1 Low-Risk  1063 1 Low-Risk   481 1
Low-Risk   105 1 Low-Risk   641 1 Low-Risk   390 1
Low-Risk   288 1 Low-Risk   421 1 Low-Risk    79 1
Low-Risk   748 1 Low-Risk   486 1 Low-Risk    48 1
Low-Risk   272 1 Low-Risk  1074 1 Low-Risk   381 1
Low-Risk    10 1 Low-Risk    53 1 Low-Risk    80 1
Low-Risk    35 1 Low-Risk   248 1 Low-Risk   704 1
Low-Risk   211 1 Low-Risk   219 1 Low-Risk   606 1
High-Risk 2640 0 High-Risk 2430 0 High-Risk 2252 0
High-Risk 2140 0 High-Risk 2133 0 High-Risk 1238 0
High-Risk 1631 0 High-Risk 2024 0 High-Risk 1345 0
High-Risk 1136 0 High-Risk  845 0 High-Risk  422 1
High-Risk  162 1 High-Risk   84 1 High-Risk  100 1
High-Risk    2 1 High-Risk   47 1 High-Risk  242 1
High-Risk  456 1 High-Risk  268 1 High-Risk  318 1
High-Risk   32 1 High-Risk  467 1 High-Risk   47 1
High-Risk  390 1 High-Risk  183 1 High-Risk  105 1
High-Risk  115 1 High-Risk  164 1 High-Risk   93 1
High-Risk  120 1 High-Risk   80 1 High-Risk  677 1
High-Risk   64 1 High-Risk  168 1 High-Risk   74 1
High-Risk   16 1 High-Risk  157 1 High-Risk  625 1
High-Risk   48 1 High-Risk  273 1 High-Risk   63 1
High-Risk   76 1 High-Risk  113 1 High-Risk  363 1

Statement Summary

For character columns, the X-axis is always of TYPE=DISCRETE. For numeric columns, both the X- and the Y-axis are of TYPE=LINEAR by default.
You can change the axis type for numeric axes with the XAXISOPTS= and YAXISOPTS= options of the containing overlay layout.
The STEPPLOT statement uses X values in data order, unless the CONNECTORDER= option is used to change the order.

Required Arguments

X=column | expression
specifies the column of the X values.
Y=numeric-column | expression
specifies the numeric column of the Y values.

Options

Statement Option
Description
Breaks the plot line at the occurrences of the missing values of the Y variable.
Specifies the width of the group clusters as a fraction of the midpoint spacing.
Specifies how to connect the data points to form the step line.
Specifies a label for the step line.
Specifies the color and font attributes of the step line label.
Specifies the location of the step label relative to the plot area.
Specifies the position of the step line labels relative to the step line.
Specifies a column that supplies values for the data point labels.
Specifies the color and font attributes of the data labels.
Specifies the location of the data labels relative to the data points and markers, when displayed.
Specifies the degree of the transparency of the step lines, markers, and error bars, when displayed.
Specifies an amount to offset all step lines and markers from discrete X values when graphing multiple response variables side by side on a common axis.
Specifies whether to display markers on the step line.
Specifies the attributes of the error bars that are associated with the data points.
Specifies the values of the lower endpoints on the Y error bars.
Specifies the values of the upper endpoints of the Y error bars.
Creates a separate step plot for each unique group value of the specified column.
Specifies whether grouped step lines and markers are overlaid or clustered around the category midpoints.
Specifies the relative position of the step lines and markers for a group display.
Specifies whether missing values of the group variable are included in the plot.
Specifies indices for mapping step-line attributes (color, marker symbol, and line pattern) to one of the GraphData1–GraphDataN style elements.
Specifies whether the steps are connected.
Specifies the location of the data point relative to the step.
Specifies a label for a legend.
Specifies the line attributes of the step line.
Specifies the attributes of the data markers.
Assigns a name to a plot statement for reference in other template statements.
Specifies that the data columns for this plot be used for determining default axis features.
Specifies user-defined roles that can be used to display information in the tooltips.
Specifies the information to display when the cursor is positioned over the step line.
Specifies display formats for information defined by roles.
Specifies display labels for information defined by roles.
Specifies an HTML page to display when a series line segment is selected.
Specifies whether data are mapped to the primary X (bottom) axis or the secondary X2 (top) axis.
Specifies whether data are mapped to the primary Y (left) axis or the secondary Y2 (right) axis.
BREAK=boolean
determines whether the plot line should show breaks at occurrences of missing values of the Y variable.
Default: FALSE
When this option is set to FALSE, missing values are skipped and the line continues through the missing value and to the next point.
CLUSTERWIDTH= number
specifies the width of the group clusters as a fraction of the midpoint spacing on a discrete axis or a fraction of the minimum interval between adjacent data values on an interval axis.
Default: 0.85
Range: 0.1 (narrowest) to 1 (widest)
Interaction: For this option to take effect, the GROUP= option must also be specified, and the GROUPDISPLAY= option must be set to CLUSTER.
CONNECTORDER=XVALUES | XAXIS
specifies how to connect the data points to form the step line.
Default: XVALUES
XVALUES
Connects data points in the data order of the X variable.
XAXIS
Connects data points sorted by their X values.
When the input data for the step lines is not sorted by the X variable, set this option to XAXIS to assure the expected connect order.
CURVELABEL="string" | column | expression
specifies a label for the step line.
Default: no curve label is displayed
Interaction:
  • For non-grouped data, use "string".
  • For grouped data, use a column to define the labels for each group value.
The font and color attributes for the label are specified by the CURVELABELATTRS= option.
CURVELABELATTRS=style-element | style-element (text-options) | (text-options)
specifies the color and font attributes of the step line labels. See General Syntax for Attribute Options for the syntax on using a style-element and Text Options for available text-options.
Default:
  • For non-grouped data, the GraphValueText style element.
  • For grouped data, text color is derived from the GraphData1:ContrastColor–GraphDataN:ContrastColor style references. The font is derived from the GraphValueText style element.
Interaction: For this option to take effect, the CURVELABEL= option must also be used.
Interaction: This option’s COLOR= setting overrides the colors indicated by the GROUP= option.
When the GROUP= option is used, each distinct group value might be represented by a different color. The series label that is associated with the group is assigned the group color. This option can be used to specify a single color for all series labels in a graph, without affecting items that have the group color, such as lines and marker symbols.
CURVELABELLOCATION=INSIDE | OUTSIDE
specifies the location of the step label relative to the plot area.
Default: INSIDE
INSIDE
inside the plot area
OUTSIDE
outside the plot area
Restriction: OUTSIDE cannot be used when the STEPPLOT is used in multicell layouts such as LATTICE, DATAPANEL, or DATALATTICE, where axes are external to the grid.
Interaction: For this option to take effect, the CURVELABEL= option must also be specified.
Interaction: This option is used in conjunction with the CURVELABELPOSITION= option to determine where the curve labels appear. For more information, see Location and Position of Curve Labels.
CURVELABELPOSITION=AUTO | MAX | MIN | START | END
specifies the position of the step line labels relative to the step line.
Default: AUTO when CUVELABELLOCATION=OUTSIDE. END when CURVELABELLOCATION=INSIDE
AUTO
Only used when CURVELABELPOSITION=OUTSIDE. The step label is positioned automatically near the step boundary along unused axes whenever possible (typically Y2 and X2) to avoid collision with tick values.
MAX
Forces the step label to appear near maximum step values (typically, upper right)
MIN
Forces the step label to appear near minimum step values (typically, lower left)
START
Only used when CURVELABELLOCATION=INSIDE. Forces the step label to appear near the beginning of the steps. Particularly useful when the step line “spirals” around.
END
Only used when CURVELABELLOCATION=INSIDE. Forces the step label to appear near the end of the steps. Particularly useful when the step line “spirals” around.
Restriction: The AUTO setting is ignored if CURVELABELLOCATION= INSIDE is specified. The START and END settings are ignored if CURVELABELLOCATION=OUTSIDE is specified.
Interaction: For this option to take effect, the CURVELABEL= option must also be specified.
Interaction: This option is used in conjunction with the CURVELABELLOCATION= option to determine where the step label appears. For more information, see Location and Position of Curve Labels.
DATALABEL=column | expression
specifies a column that supplies values for the data point labels.
Default: no data labels are displayed
The label positions are adjusted to prevent the labels from overlapping.
DATALABELPOSITION = AUTO | TOPRIGHT | TOP | TOPLEFT | LEFT | CENTER | RIGHT | BOTTOMLEFT | BOTTOM | BOTTOMRIGHT
specifies the location of the data labels relative to the data points and markers, when displayed.
Default: AUTO
DATALABELATTRS=style-element | style-element (text-options) | (text-options)
specifies the color and font attributes of the data labels. See General Syntax for Attribute Options for the syntax on using a style-element and Text Options for available text-options.
Default:
  • For non-grouped data, the GraphDataText style element.
  • For grouped data, the GraphData1:ContrastColor–GraphDataN:ContrastColor style references.
Interaction: For this option to take effect, the DATALABEL= option must also be specified.
Interaction: This option’s COLOR= setting overrides the colors indicated by the GROUP= option.
When the GROUP= option is used, each distinct group value might be represented by a different color. The data label that is associated with the group is assigned the group color. This option can be used to specify a single color for all data labels in a graph, without affecting items that have the group color, such as error bars and marker symbols.
DATATRANSPARENCY=number
specifies the degree of the transparency of the step lines, markers, and error bars, when displayed.
Default: 0
Range: 0 (opaque) to 1 (entirely transparent)
DISCRETEOFFSET=number
specifies an amount to offset all step lines and markers from discrete X values when graphing multiple response variables side by side on a common axis.
Default: 0 (no offset, all step lines and markers are centered on the discrete X values)
Range: -0.5 to +0.5, where .5 represents half the distance between discrete ticks. A positive offset is to the right. If the layout’s axis options set REVERSE=TRUE, then the offset direction is also reversed.
DISPLAY=STANDARD | ALL | (display-options)
specifies whether to display markers on the step line.
Default: STANDARD
STANDARD
displays a step line without markers.
ALL
displays a step line with markers.
(display-options)
a list of options enclosed in parentheses. Currently, only the following option is available for the list:
MARKERS—displays a step line with markers
Use the MARKERATTRS= and LINEATTRS= options to control the appearance of the line and markers.
ERRORBARATTRS=style-element | style-element (line-options) | (line-options)
specifies the attributes of the error bars that are associated with the data points. See General Syntax for Attribute Options for the syntax on using a style-element and Line Options for available line-options.
Default:
  • For non-grouped data, the GraphError style element.
  • For grouped data, the LineStyle and LineThickness attributes of the GraphError style element and the ContrastColor attribute of the GraphData1–GraphDataN style elements. (The LineStyle does not apply to the "serif" parts of the error bars.)
Interaction: For this option to take effect, error bars must be displayed by the ERRORLOWER= or ERRORUPPER= options.
ERRORLOWER=numeric-column | expression
specifies the values of the lower endpoints on the Y error bars.
Default: The lower segment of the error bars is not drawn.
Interaction: If the GROUP= option is specified, this option is ignored.
The error bar values must be absolute data values, not data values relative to the value of the bar.
The appearance of the error bars is controlled by the ERRORBARATTRS= option.
ERRORUPPER=numeric-column | expression
specifies the values of the upper endpoints on the Y error bars.
Default: The upper segment of the error bars is not drawn.
Interaction: If the GROUP= option is specified, this option is ignored.
The error bar values must be absolute data values, not data values relative to the value of the bar.
The appearance of the error bars is controlled by the ERRORBARATTRS= option.
GROUP=column | discrete-attr-var | expression
creates a distinct set of lines, markers, and data labels for each unique group value of the specified column.
discrete-attr-var
specifies a discrete attribute variable that is defined in a DISCRETEATTRVAR statement.
Restriction: A discrete attribute variable specification must be a direct reference to the attribute variable. It cannot be set by a dynamic variable.
Default: Each distinct group value might be represented in the graph by a different combination of color, line pattern, and marker symbol. Lines and markers vary according to the ContrastColor, LineStyle, and MarkerSymbol attributes of the GraphData1–GraphDataN style elements. Line thickness (for grouped and ungrouped data) is controlled by the LINEATTRS= option.
Interaction: The group values are mapped in the order of the data, unless the INDEX= option is used to alter the default sequence of marker symbols, colors, and line patterns.
Interaction: The marker size is set by the MARKERATTRS= option.
Interaction: The INCLUDEMISSINGGROUP= option controls whether missing group values are considered a distinct group value.
Tip: The representations that are used to identify the groups can be overridden. For example, each distinct group value is often represented by a different line pattern, but the LINEATTRS= (PATTERN=pattern) option could be used to assign the same line pattern to all of the plot’s line patterns, letting line color indicate group values. Likewise, LINEATTRS= (COLOR= color) could be used to assign the same color to all lines, letting line pattern indicate group values.
GROUPDISPLAY= OVERLAY | CLUSTER
specifies whether grouped step lines and markers are overlaid or clustered around the category midpoints.
Default: OVERLAY
OVERLAY
step lines and markers for matching category values are centered on the midpoints and superimposed on each other.
CLUSTER
step lines and markers for matching category values are clustered around the midpoints on a discrete axis or around the intervals on an interval axis. Each set of group values is centered at the midpoint for the category.
Interaction: For this option to take effect, the GROUP= option must also be specified.
GROUPORDER=DATA | ASCENDING | DESCENDING
specifies the relative position of the step lines and markers for group display. It also sets the default order of the groups in the legend.
Default: DATA
DATA
shows each group within a category in data order of the group column.
ASCENDING
shows each group within a category in ascending order of the group column. See the Details for more information.
DESCENDING
shows each group within a category in descending order of the group column. See the Details for more information.
Interaction: For this option to take effect, the GROUP= must also be specified.
Interaction: The SORTORDER= setting in a DISCRETELEGEND statement overrides the legend item order.
Note: Attributes such as color, symbol, and pattern are assigned to each group in the DATA order by default regardless of the GROUPORDER= option setting.
Note: The ASCENDING and DESCENDING settings linguistically sort the group values within each category (or X value) for display position purposes only. The data order of the observations and the visual attributes that are assigned to the group values remain unchanged.
Tip: The INDEX= option can be used to alter the default sequence of visual attributes that is assigned to the group values.
Details: By default, the value that is set for this option determines the order in which attributes are assigned to each group. It also determines the order in which the groups are displayed in the legend.
For ASCENDING and DESCENDING sort orders, the order is based on the data type:
  • For Numeric data, the order is based on unformatted values.
  • For Character data the order is based on formatted values.
The ASCENDING and DESCENDING settings perform a linguistic sort on the group items and have the same effect as sorting the input data. However, the data is not changed.
INCLUDEMISSINGGROUP=boolean
specifies whether missing values of the group variable are included in the plot.
Default: TRUE
Interaction: For this option to take effect, the GROUP= option must also be specified.
Tip: Unless a discrete attribute map is in effect or the INDEX= option is used, the attributes of the missing group value are determined by the GraphMissing style element except when the MISSING= system option is used to specify a non-default missing character or when a user-defined format is applied to the missing group value. In those cases, the attributes of the missing group value are determined by a GraphData1–GraphDataN style element.
INDEX=numeric-column | expression
specifies indices for mapping step-line attributes (color, marker symbol, and line pattern) to one of the GraphData1–GraphDataN style elements.
Default: no default
Restriction: If the value of the numeric-column is missing or is less than 1, the observation is not used in the analysis. If the value is not an integer, only the integer portion is used.
Interaction: For this option to take effect, the GROUP= option must also be specified.
Interaction: All of the indexes for a specific group value must be the same. Otherwise, the results are unpredictable.
Interaction: If this option is not used, then the group values are mapped in the order of the data.
Interaction: The index values are 1-based indices. For the style elements in GraphData1–GraphDataN, if the index value is greater than N, then a modulo operation remaps that index value to a number less than N to determine which style element to use.
Discussion: Indexing can be used to collapse the number of groups that are represented in a graph. For more information, see Remapping Groups for Grouped Data.
JOIN=boolean
specifies whether the steps are connected.
Default: TRUE
JUSTIFY= (LEFT | CENTER | RIGHT)
specifies the location of the data point relative to the step.
illustration of step positions
Default: LEFT
LEGENDLABEL= "string"
specifies a label for the legend item that is associated with this plot.
Default: The Y-variable label. If a label is not defined, the Y-variable name.
Restriction: This option applies only to an associated DISCRETELEGEND statement.
Interaction: If the GROUP= option is specified, this option is ignored.
LINEATTRS=style-element | style-element (line-options) | (line-options)
specifies the attributes of the step line connecting the data points. See General Syntax for Attribute Options for the syntax on using a style-element and Line Options for available line-options.
Default:
  • For non-grouped data, the GraphDataDefault style element.
  • For grouped data, the ContrastColor and LineStyle attributes of the GraphData1–GraphDataN style elements, and the GraphDataDefault:LineThickness style reference.
MARKERATTRS=style-element | style-element (marker-options) | (marker-options)
specifies the attributes of the data markers. See General Syntax for Attribute Options for the syntax on using a style-element and Marker Options for available marker-options.
Default:
  • For non-grouped data, GraphDataDefault style element.
  • For grouped data, the MarkerSymbol and ContrastColor attributes of the GraphData1–GraphDataN style elements, and the GraphDataDefault:MarkerSize style reference.
Interaction: DISPLAY=ALL or DISPLAY=(MARKERS) must be set for this option to have any effect.
Interaction: This option’s COLOR= suboption overrides the default behavior for grouped data: all markers the same color and the marker symbol alone distinguishes the markers.
Interaction: This option’s SYMBOL= suboption overrides the default behavior for grouped data: it holds the marker constant across group values and marker color alone distinguishes the markers.
NAME="string"
assigns a name to a plot statement for reference in other template statements.
Default: no default
Restriction: The string is case sensitive, cannot contain spaces, and must define a unique name within the template.
The specified name is used primarily in legend statements to coordinate the use of colors, marker symbols, and line patterns between the graph and the legend.
PRIMARY=boolean
specifies that the data columns for this plot be used for determining axis types and labels.
Default: FALSE
Restriction: This option is ignored if the plot is placed under a GRIDDED or LATTICE layout block.
Details: This option is needed only when two or more plots within an overlay-type layout contribute to a common axis. For more information, see When Plots Share Data and a Common Axis.
ROLENAME=(rolename-list)
specifies user-defined roles that can be used to display information in the tooltips.
Default: no user-defined roles
(rolename-list)
a blank-separated list of rolename = column pairs.
For example, ROLENAME= (TIP1=OBS) assigns the column OBS to the user-defined role TIP1.
Requirement: The role names that you choose must be unique and different from the pre-defined roles X, Y, CURVELABEL, DATALABEL, ERRORLOWER, ERRORUPPER, GROUP, and INDEX.
Interaction: For this option to take effect, the TIP= option must also be used.
This option provides a way to add to the data columns that appear in tooltips specified by the TIP= option.
TIP=(role-list)
specifies the information to display when the cursor is positioned over the step line. If this option is used, it replaces all the information displayed by default. Roles for columns that do not contribute to the step plot can be specified along with roles that do.
Default: The columns assigned to these roles are automatically included in the tooltip information: X, Y, DATALABEL, ERRORLOWER, ERRORUPPER, and GROUP.
(role-list)
an ordered, blank-separated list of unique STEPPLOT and user-defined roles. STEPPLOT roles include X, Y, CURVELABEL, DATALABEL, ERRORLOWER, ERRORUPPER, and GROUP.
Note: CURVELABEL is considered a role only when it is assigned a column of values. It is not considered a role and does not display tooltips when assigned a string.
User-defined roles are defined with the ROLENAME= option.
The following example displays tooltips for the columns assigned to the roles X and Y as well as the column OBS, which is not assigned to any pre-defined StepPlot role. The OBS column must first be assigned a role.
  ROLENAME=(TIP1=OBS)
  TIP= (TIP1 X Y)
Requirement: To generate tooltips, you must include an ODS GRAPHICS ON statement that has the IMAGEMAP option specified, and write the graphs to the ODS HTML destination.
Interaction: The labels and formats for the TIP variables can be controlled with the TIPLABEL= and TIPFORMAT= options.
TIPFORMAT=(role-format-list)
specifies display formats for tip columns.
Default: The column format of the variable assigned to the role or BEST6. if no format is assigned to a numeric column.
(role-format-list)
a list of rolename = format pairs separated by blanks.
  ROLENAME=(TIP1=OBS)
  TIP= (TIP1 X ERRORUPPER ERRORLOWER)
  TIPFORMAT=(ERRORUPPER=5.3 ERRORLOWER=5.3) 
Requirement: This option provides a way to control the formats of columns that appear in tooltips. Only the roles that appear in the TIP= option are used. Columns must be assigned to the roles for this option to have any effect. See the ROLENAME= option.
TIPLABEL=(role-format-list)
specifies display labels for tip columns.
Default: The column label or column name of the variable assigned to the role.
(role-label-list)
a list of rolename = "string" pairs separated by blanks.
  ROLENAME=(TIP1=OBS) 
  TIP= (TIP1 X ERRORUPPER ERRORLOWER)
  TIPLABEL=(ERRORUPPER="1 STD ERROR"
  ERRORLOWER="-1 STD ERROR")
Requirement: This option provides a way to control the labels of columns that appear in tooltips. Only the roles that appear in the TIP= option are used. Columns must be assigned to the roles for this option to have any effect. See the ROLENAME= option.
URL=character-column
specifies an HTML page to display when a step line segment is selected.
Default: no default
character-column
each value of the column must be a valid HTML page reference (HREF). For example, http://www.sas.com/technologies/analytics/index.html is a valid reference.
Requirement: To generate selectable bars, you must include an ODS GRAPHICS ON statement that has the IMAGEMAP option specified, and write the graphs to the ODS HTML destination.
XAXIS=X | X2
specifies whether data are mapped to the primary X (bottom) axis or to the secondary X2 (top) axis.
Default: X
Interaction: The overall plot specification and the layout type determine the axis display for the specified axis. For more information, see How Axis Features Are Determined.
YAXIS=Y | Y2
specifies whether data are mapped to the primary Y (left) axis or to the secondary Y2 (right) axis.
Default: Y
Interaction: The overall plot specification and the layout type determine the axis display for the specified axis. For more information, see How Axis Features Are Determined.