Location and Position of Curve Labels
Overview
Curve Label Location Relative to the Plot Area
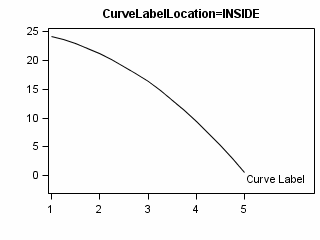
By default, the label for a
curve line is displayed inside of the plot area. The following figure
shows the default location of the label for a series plot labeled
“Curve Label”:
Depending on the shape
of the curve line, its distribution of values, and the other plot
elements that must be displayed within the plot area, GTL might have
to add an offset (see Adjusting Axis Offsets) to one of
the plot’s axis lines to provide enough room for the curve
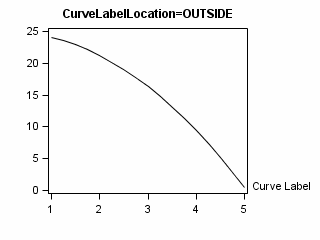
label. To prevent the offset of the axis line, you can move the curve
label outside of the plot area by specifying CURVELABELLOCATION=OUTSIDE
on the plot statement:
Curve Label Position Relative to the Curve Line
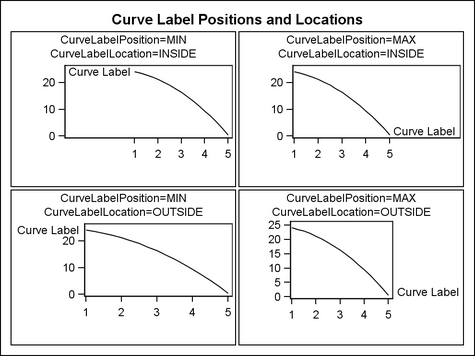
Given a curve label’s
location inside or outside of the plot area, a plot statement’s
CURVELABELPOSITION= option can adjust the label’s position
relative to the curve line. For example, the following positions are
available for a series plot (for some plots, START and END are not
available):
Only used when CURVELABELLOCATION=OUTSIDE.
The curve label is positioned automatically near the end series line
along unused axes whenever possible (typically Y2 or X2) to avoid
collision with tick values.
When CURVELABELLOCATION=INSIDE,
you can choose whether to position the curve label near the START
or END of the curve, or near the minimum data values (MIN) or maximum
data values (MAX). START and END use a different algorithm than MIN
and MAX. They are particularly useful for spiral-shaped curves whose
end points do not correlate with the minimum and maximum data values.
In those cases, START or END provide “better” label
locations than MIN and MAX.
When CURVELABELLOCATION=OUTSIDE
and CURVELABELPOSITION=AUTO, a “good” position is automatically
chosen to avoid collision with the axis information.
-
The minimum or maximum axis tick marks can be adjusted (see Adjusting Axis Offsets) so that the label can be placed inside the plot area. Increasing label length decreases the area available for displaying plots.