Example Program and Statement Details

The following sections provide a basic overview of the BANDPLOT statement.
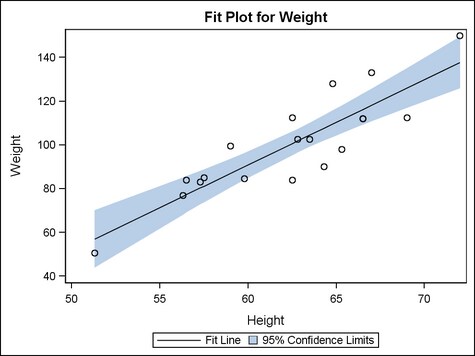
Example Graph

The following graph was generated by the Example Program:
Fit Plot for Weight

Example Program

proc template;
  define statgraph bandplot;
    begingraph;
      entrytitle "Fit Plot for Weight";
      layout overlay;
        bandplot x=height limitupper=uppermean
          limitlower=lowermean /
          name="band" modelname="fit"
          legendlabel="95% Confidence Limits";		
        scatterplot x=height y=weight / primary=true;
        seriesplot x=height y=predict / name="fit"
          legendlabel="Fit Line";
        discretelegend  "fit" "band";
      endlayout;
    endgraph;
  end;
run;

proc sgrender data=sashelp.classfit template=bandplot;
run;

Statement Summary

A band plot can specify an X column with Y upper and lower limits, or a Y column with X upper and lower limits. If you specify the X argument, you must specify LIMITLOWER and LIMITUPPER arguments for the Y values to apply the limits to the Y axis. If you specify the Y argument, you must specify LIMITLOWER and LIMITUPPER arguments for the X values to apply the limits to the X axis.
When you use a BANDPLOT statement to display prediction or confidence limits, the band plot can be used with another plot that specifies a fitted model. For example, it can be used with a series or step plot. In these cases, use the BANDPLOT option MODELNAME= or TYPE= to identify the interpolation for the band.
You can use the BANDPLOT statement in displays that are independent of other plots. For example, a band plot can be used to define yellow and green areas in an OVERLAY LAYOUT statement that also contains a scatter plot. This use implies concern for any of the scatter plot values that fall in the yellow area and comfort for any values that fall in the green area. For this use, the upper and lower limits would be specified by a constant.
Note: The BANDPLOT statement is optimized to work as a Confidence or Prediction band. If the band is self intersecting (not sorted for X or for Y), the resulting band is unpredictable. With unsorted data, the band that is generated for an output Raster Image might not match the band that is generated for an output Vector Graphic.

Arguments

Overview

Either an X= or Y= argument must be specified. Only one of them can be used. In addition, the LIMITLOWER= and LIMITUPPER= arguments must be used to specify the lower and upper lines for the band.

Argument Descriptions When X= Is Used

X=column | expression
specifies X values. Numeric or character values can be used.
LIMITLOWER=number | numeric-column | expression
specifies a constant or column representing the Y value or Y values of the lower band line. If a constant is specified, a straight line is drawn.
LIMITUPPER=number | numeric-column | expression
specifies a constant or column representing the Y value or Y values of the upper band line. If a constant is specified, a straight line is drawn.

Argument Descriptions When Y= Is Used

Y=column | expression
specifies Y values. Numeric or character values can be used.
LIMITLOWER=number | numeric-column | expression
specifies a constant or column representing the X value or X values of the lower band line. If a constant is specified, a straight line is drawn.
LIMITUPPER=number | numeric-column | expression
specifies a constant or column representing the X value or X values of the upper band line. If a constant is specified, a straight line is drawn.

Options

Statement Option
Description
Specifies how to connect the data points to form the band lines.
Specifies the color and font attributes of the upper and lower band labels.
Specifies a label for the lower band limit.
Specifies a label for the upper band limit.
Specifies the location of the band labels relative to the plot area.
Specifies the position of the band labels relative to the curve line.
Specifies the degree of the transparency of the band fill and band outline.
Specifies an amount to offset all bands from X values for a discrete X axis, or from Y values for a discrete Y axis.
Specifies whether to display an outlined band area, a filled band area, or an outlined and filled band area.
Specifies whether a constant band is to be drawn to the area bounded by the axes.
Specifies the appearance of the band area.
Creates a separate band plot for each unique group value of the specified column.
Specifies whether missing values of the group variable are included in the plot.
Specifies indices for mapping line attributes (color and pattern) to one of the GraphData1 - GranphDataN style elements.
Specifies the location of the data point relative to the step when TYPE=STEP
Specifies the label for a legend.
Specifies the name of the plot from which to derive the interpolation of the band.
Assigns a name to a plot statement for reference in other template statements.
Specifies the properties of the band lines.
Specifies user-defined roles that can be used to display information in the tooltips.
Specifies the information to display when the cursor is positioned over a graph element.
Specifies display formats for information defined by roles.
Specifies display labels for information defined by roles.
Specifies how the data points of the lower and upper limits are joined.
Specifies whether data are mapped to the primary X (bottom) axis or the secondary X2 (top) axis.
Specifies whether data are mapped to the primary Y (left) axis or the secondary Y2 (right) axis.
CONNECTORDER=VALUES | AXIS
specifies how to connect the data points to form the band lines.
Default: VALUES
VALUES
Connects data points in the order read from the X variable (or Y variable).
AXIS
Connects data points as they occur left-to-right along the X axis (or bottom-to-top along the Y axis). Use this value to ensure the expected connect order for certain types of series lines (for example, time series) when the input data might not be sorted by the X variable (or Y variable).
CURVELABELATTRS=style-element | style-element (text-options) | (text-options)
specifies the color and font attributes of the band labels. See General Syntax for Attribute Options for the syntax on using a style-element and Text Options for available text-options.
Default:
  • For non-grouped data, the GraphValueText style element.
  • For grouped data, text color is derived from the GraphData1:ContrastColor - GraphDataN:ContrastColor style references. The font is derived from the GraphValueText style element.
CURVELABELLOWER= "string" | column
specifies a label for the lower band limit.
Default: no labels are displayed
Interaction: For non-grouped data, use "string".
Interaction: For grouped data, use a column to define the lower band labels for each group value. All of the labels for a specific group value must be the same. Otherwise, the results are unpredictable.
The font and color attributes for the label are specified by the CURVELABELATTRS= option.
CURVELABELUPPER= "string" | column
specifies a label for the upper band limit.
Default: no labels are displayed
Interaction: For non-grouped data, use "string".
Interaction: For grouped data, use a column to define the upper band labels for each group value. All of the labels for a specific group value must be the same. Otherwise, the results are unpredictable.
The font and color attributes for the label are specified by the CURVELABELATTRS= option.
CURVELABELLOCATION= INSIDE | OUTSIDE
specifies the location of the band labels relative to the plot area.
Default: INSIDE
INSIDE
inside the plot area
OUTSIDE
outside the plot area
Restriction: OUTSIDE cannot be used when the BANDPLOT is used in multicell layouts such as LATTICE, DATAPANEL, or DATALATTICE where axes might be external to the grid.
Interaction: This option is used in conjunction with the CURVELABELPOSITION= option to determine where the band labels appear. For more information, see Location and Position of Curve Labels.
CURVELABELPOSITION=AUTO | MAX | MIN |START | END
Specifies the position of the band labels relative to the curve line.
Default: AUTO when CUVELABELLOCATION=OUTSIDE. END when CURVELABELLOCATION=INSIDE.
AUTO
Only used when CURVELABELLOCATION=OUTSIDE. Band labels are positioned automatically near the band boundary along unused axes whenever possible (typically Y2 and X2).
MAX
Forces the band labels to appear near maximum band values (maximum-values for horizontal curves, and maximum Y-values for vertical curves).
MIN
Forces the band label to appear near minimum band values (minimum X-values for horizontal curves, and minimum Y-values for vertical curves)
START
Only used when CURVELABELLOCATION=INSIDE. Forces band labels to appear near the beginning of the curve. Particularly useful when the curve line has a spiral shape.
END
Only used when CURVELABELLOCATION=INSIDE. Forces band labels to appear near the end of the curve. Particularly useful when the curve line has a spiral shape.
Restriction: The AUTO setting is ignored if CURVELABELLOCATION=INSIDE is specified. The START and END settings are ignored if CURVELABELLOCATION=OUTSIDE is specified.
Interaction: This option is used in conjunction with the CURVELABELLOCATION= option to determine where the band labels appear. For more information, see Location and Position of Curve Labels.
DATATRANSPARENCY=number
specifies the degree of the transparency of the band fill and band outline.
Default: 0
Range: 0 (opaque) to 1 (entirely transparent)
Tip: The FILLATTRS= option can be used to set transparency for just the band area. You can combine this option with FILLATTRS= to set one transparency for the band outline but a different transparency for the band fill. Example:
datatransparency=0.2 fillattrs=(transparency=0.6)
DISCRETEOFFSET=number
specifies an amount to offset all bands from X values for a discrete X axis, or from Y values for a discrete Y axis. If both axes are discrete, the offset applies to both axes.
Default: 0 (no offset, all markers are centered on the X values for a discrete X axis, or on the Y values for a discrete Y axis)
Range: -0.5 to +0.5 where .5 represents half the distance between discrete ticks. A positive offset is to the right on discrete X values and up on discrete Y values. If the layout’s axis options set REVERSE=TRUE, the offset direction is also reversed.
DISPLAY=STANDARD | ALL | (display-options)
specifies whether to display an outlined band area, a filled band area, or an outlined and filled band area.
Default: The value of the DisplayOpts attribute of the GraphBand style element, which is DisplayOpts="FILL" by default.
STANDARD
displays filled band with no outline
ALL
displays an outlined, filled band
(display-options)
a list of space-delimited options, enclosed in parentheses, that must include one of the following:
OUTLINE—displays an outlined band
FILL—displays a filled band
Use the OUTLINEATTRS= and FILLATTRS= options to control the appearance of the band.
EXTEND=boolean
specifies whether the constant or "step" band is to be drawn to the area bounded by the axes.
Default: FALSE
Requirement: When this option is used for a constant band, constants must be specified for the upper and lower band limits. This requirement does not apply to "step" bands.
Restriction: This option is ignored if the X or Y value is character.
If this option is not specified, then there can be a small gap between the line and the axis. The gap is controlled by the axis offset. If the offset is set to 0, then there is no gap.
FILLATTRS=style-element | style-element (fill-options) | (fill-options)
specifies the appearance of the filled band area. See General Syntax for Attribute Options for the syntax on using a style-element and Fill Options for available fill-options.
Default:
  • For non-grouped data, the GraphDataDefault:Color style reference.
  • For grouped data, the Color attribute of GraphData1 - GraphDataN style elements.
Interaction: For this option to have any effect, the fill must be enabled by the ODS style or the DISPLAY= option.
Tip: The DATATRANSPARENCY= option sets the transparency for both the band fill and band outline. You can combine this option with DATATRANSPARENCY= to set one transparency for the band outline but a different transparency for the band fill. Example:
datatransparency=0.2 fillattrs=(transparency=0.6)
GROUP=column | discrete-attr-var | expression
creates a separate band plot for each unique group value of the specified column.
discrete-attr-var
specifies a discrete attribute variable that is defined in a DISCRETEATTRVAR statement.
Restriction: A discrete attribute variable specification must be a direct reference to the attribute variable. It cannot be set by a dynamic variable.
Default:
  • If the band outline is enabled by the ODS style or the DISPLAY= option, each distinct group value is represented in the graph by a different combination of outline color (defined by the GraphData1:ContrastColor - GraphDataN:ContrastColor style references) and outline pattern (defined by the attribute of the GraphData1:LineStyle - GraphDataN:LineStyle style references).
  • If the band fill is enabled by the ODS style or the DISPLAY= option, each distinct group value is represented in the graph by a different fill color (defined by the GraphData1:Color - GraphDataN:Color style references).
Restriction: This option can be used only when a numeric column is specified for the upper limit or the lower limit of the band plot. The other limit could be a constant, if desired.
Interaction: To label grouped band plots, you must specify CURVELABELLOWER==column and CURVELABELUPPER==column.
Interaction: The group values are mapped in the order of the data, unless the INDEX= option is used to alter the default sequence of colors and line patterns.
Interaction: The INCLUDEMISSINGGROUP option controls whether missing group values are considered a distinct group value.
Tip: The representations that are used to identify the groups can be overridden individually. For example, each distinct group value is represented by a different line pattern for the band lines, but the PATTERN= suboption of the OUTLINEATTRS= option could be used to assign the same line pattern to all band outlines.
INCLUDEMISSINGGROUP=boolean
specifies whether missing values of the group variable are included in the plot.
Default: TRUE
Interaction: For this option to take effect, the GROUP= option must also be specified.
Tip: Unless a discrete attribute map is in effect or the INDEX= option is used, the attributes of the missing group value are determined by the GraphMissing style element except when the MISSING= system option is used to specify a non-default missing character or when a user-defined format is applied to the missing group value. In those cases, the attributes of the missing group value are determined by a GraphData1–GraphDataN style element.
INDEX=numeric-column | expression
specifies indices for mapping line attributes (color and pattern) to one of the GraphData1 - GranphDataN style elements.
Default: no default
Restriction: If the value of the numeric-column is missing or is less than 1, the observation is not used in the analysis. If the value is not an integer, only the integer portion is used.
Interaction: For this option to take effect, the GROUP= option must also be specified.
Interaction: All of the indexes for a specific group value must be the same. Otherwise, the results are unpredictable.
Interaction: The index values are 1-based indices. For the style definitions in GraphData1 - GraphDataN, if the index value is greater than N, then a modulo operation remaps that index value to a number less than N to determine which style to use.
Interaction: If this option is not used, then the group values are mapped in the order of the data.
Discussion: Indexing can be used to collapse the number of groups that are represented in a graph. For more information, see Remapping Groups for Grouped Data.
JUSTIFY=LEFT | CENTER | RIGHT
specifies the location of the data point relative to the step when TYPE=STEP.
location of the data point
Default: LEFT
Requirement: TYPE= must also be specified for this option to have any effect.
Interaction: If the MODELNAME= option is specified, this option is ignored.
LEGENDLABEL= "string"
specifies a label for the legend item that is associated with this plot.
Default: The string specified on the NAME= option.
Restriction: This option applies only to an associated DISCRETELEGEND statement.
Interaction: If the GROUP= option is specified, this option is ignored.
MODELNAME= "plot-name"
specifies the name of the plot from which to derive the interpolation for the band.
Default: no default
Requirement: plot-name must be the name that has been assigned on the associated plot’s NAME= option.
Interaction: This option overrides the JUSTIFY= and TYPE= options.
Tip: If this option is not specified, then the interpolation is set by the TYPE= option.
When this option is used, the band plot forms prediction or confidence limits for the plot that supplies the fitted model.
NAME="string"
assigns a name to a plot statement for reference in other template statements.
Default: no default
Restriction: The string is case sensitive, cannot contain spaces, and must define a unique name within the template.
Interaction: The string is used as the default legend label if the LEGENDLABEL= option is not used.
The specified name is used primarily in legend statements to coordinate the use of colors and line patterns between the graph and the legend.
OUTLINEATTRS=style-element | style-element (line-options) | (line-options)
specifies the appearance of the band outlines. See General Syntax for Attribute Options for the syntax on using a style-element and Line Options for available line-options.
Default:
  • For non-grouped data, the GraphDataDefault style element.
  • For grouped data, the ContrastColor and LineStyle attributes of the GraphData1 - GraphDataN style elements.
Interaction: For this option to have any effect, the outline must be enabled by the ODS style or the DISPLAY= option.
ROLENAME=(role-name-list)
specifies user-defined roles that can be used to display information in the tooltips.
Default: no user-defined roles
(role-name-list)
a blank-separated list of role-name = column pairs.
For example, ROLENAME= (TIP1=OBS) assigns the column OBS to the user-defined role TIP1.
Requirement: The role names that you choose must be unique and different from the pre-defined roles X, Y, LIMITUPPER, LIMITLOWER, GROUP, CURVELABELUPPER, and CURVELABELLOWER.
This option provides a way to add to the data columns that appear in tooltips specified by the TIP= option.
TIP=(role-list)
specifies the information to display when the cursor is positioned over the band plot. If this option is used, it replaces all the information displayed by default. Roles for columns that do not contribute to the band plot can be specified along with roles that do.
Default: The columns assigned to these roles are automatically included in the tooltip information: X, Y, LIMITUPPER, LIMITLOWER, and GROUP.
(role-list)
an ordered, blank-separated list of unique BANDPLOT and user-defined roles. BANDPLOT roles include X, Y, LIMITUPPER, LIMITLOWER, GROUP, INDEX, CURVELABELUPPER, and CURVELABELLOWER.
Note: CURVELABELUPPER and CURVELABELLOWER are considered roles only when they are assigned a column of values. They are not considered roles and do not display tooltips when assigned a string.
User-defined roles are defined with the ROLENAME= option.
The following example displays tooltips for the columns assigned to the roles X, LIMITUPPER, and LIMITLOWER as well as the column OBS, which is not assigned to any pre-defined BandPlot role. The OBS column must first be assigned a role.
  ROLENAME=(TIP1=OBS)
  TIP=(TIP1 X LIMITUPPER LIMITLOWER)
Requirement: To generate tooltips, you must include an ODS GRAPHICS ON statement that has the IMAGEMAP option specified, and write the graphs to the ODS HTML destination.
Interaction: The labels and formats for the TIP variables can be controlled with the TIPLABEL= and TIPFORMAT= options.
TIPFORMAT=(role-format-list)
specifies display formats for tip columns.
Default: The column format of the variable assigned to the role or BEST6. if no format is assigned to a numeric column.
(role-format-list)
a list of role-name = format pairs separated by blanks.
  ROLENAME=(TIP1=OBS) 
  TIP=(TIP1 X LIMITUPPER LIMITLOWER)
  TIPFORMAT=(LIMITUPPER= 5.3 LIMITLOWER= 5.3) 
Requirement: This option provides a way to control the formats of columns that appear in tooltips. Only the roles that appear in the TIP= option are used. Columns must be assigned to the roles for this option to have any effect. See the ROLENAME= option.
TIPLABEL=(role-label-list)
specifies display labels for tip columns.
Default: The column label or column name of the variable assigned to the role.
(role-label-list)
a list of role-name = "string" pairs separated by blanks.
  ROLENAME=(TIP1=OBS) 
  TIP=(TIP1 X LIMITUPPER LIMITLOWER)
  TIPLABEL=(LIMITUPPER="90% CLU"
  LIMITLOWER="90% CLL") 
Requirement: This option provides a way to control the labels of columns that appear in tooltips. Only the roles that appear in the TIP= option are used. Columns must be assigned to the roles for this option to have any effect. See the ROLENAME= option.
TYPE= SERIES | STEP
specifies how the data points for lower and upper band boundaries are interpolated.
Default: SERIES
SERIES
The data points are joined directly using line segments (as in a SeriesPlot).
STEP
The data points are connected using a step function (as in a StepPlot).
Interaction: TYPE=STEP must be specified to enable the JUSTIFY= option.
Interaction: If the MODELNAME= option is specified, this option is ignored.
XAXIS=X | X2
specifies whether data are mapped to the primary X (left) axis or to the secondary X2 (right) axis.
Default: X
Interaction: This option is ignored if the X= argument is not specified.
Interaction: The overall plot specification and the layout type determine the axis display. For more information, see How Axis Features Are Determined.
YAXIS=Y | Y2
specifies whether data are mapped to the primary Y (bottom) axis or to the secondary Y2 (top) axis.
Default: Y
Interaction: This option is ignored if the Y= argument is not specified.
Interaction: The overall plot specification and the layout type determine the axis display. For more information, see How Axis Features Are Determined.