Example Program and Statement Details
Example Program
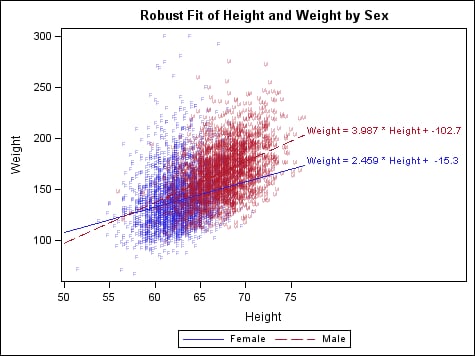
The LINEPARM statement
draws a line based on a point and the slope of the line that passes
through that point. You can use this statement to create a reference
line with any slope or, in this example, to draw a fit from a linear
regression. Many SAS/STAT procedures create output data sets containing
a Y-intercept and slope and coefficient for the linear regression
equation.
proc template;
 define statgraph lineparm;
  begingraph;
   entrytitle "Robust Fit of Height and Weight by Sex ";
   layout overlay / xaxisopts=(offsetmax=0.4);
    scatterplot x=height y=weight / group=sex
     markercharacter=eval(substr(sex,1,1))
     markercharacterattrs=(size=5pt) datatransparency=.7;
    lineparm x=0 y=intercept slope=slope /
     name="Line" group=sex
     curvelabel=eval("Weight = "||put(slope,5.3)||
       " * Height + "||put(intercept,6.1))
     curvelabellocation=inside
     curvelabelattrs=(size=8pt);
    discretelegend "Line";
   endlayout;
  endgraph;
 end;
run;

proc sort data=sashelp.heart(keep=height weight sex)
     out=heart;
  by sex;
run;

ods exclude all;
proc robustreg data=heart method=m
     outest=stats(rename=(height=slope));
  by sex;
  model weight=height;
run;

data all;
  merge heart stats(keep=intercept slope sex);
run;

ods select all;
proc sgrender data=all template=lineparm;
run;
Statement Summary
The LINEPARM statement
creates a straight line. You can generate a single line by specifying
a constant for each required argument. You can generate multiple lines
by specifying a numeric column for any or all required arguments.
If any of the X= or Y= columns contains a missing value, no line is
drawn. To request a vertical line, specify
SLOPE= . (specify
a missing value as a constant or column value).
Required Arguments
specifies the X coordinate
of a point.
By default, if the
specified value is outside of the data range, then the data range
is extended to include the specified intercept. This behavior can
be changed with the CLIP= option. If a numeric-column is
specified and the column contains missing values, no line is drawn
for the missing values.
specifies the Y coordinate
of a point.
By default, if the
specified value is outside of the data range, then the data range
is extended to include the specified intercept. This behavior can
be changed with the CLIP= option. If a numeric-column is
specified and the column contains missing values, no line is drawn
for the missing values.
Options
specifies a label for
the line.
The font and color
attributes for the label are specified by the CURVELABELATTRS= option.
specifies the color
and font attributes of the line label. See General Syntax for Attribute Options for the syntax
on using a style-element and Text Options for available text-options.
specifies the location
of the line label relative to the plot area.
Restriction: OUTSIDE
cannot be used when the LINEPARM is used in multi-cell layouts such
as LATTICE, DATAPANEL, or DATALATTICE, where axes might be external
to the grid.
Interaction: This
option is used in conjunction with the CURVELABELPOSITION= option to determine where the line
labels appear. For more information, see Location and Position of Curve Labels.
specifies the position
of the line label relative to the line end points.
Only used when CURVELABELLOCATION=OUTSIDE. The line label is positioned
automatically near the line boundary along unused axes whenever possible
(typically Y2 and X2) to avoid collision with tick values.
Interaction: This
option is used in conjunction with the CURVELABELLOCATION= option
to determine where the line label appears. For more information, see Location and Position of Curve Labels.
creates a separate
parameterized line plot for each unique group value of the specified
column.
specifies
a discrete attribute variable that is defined in a DISCRETEATTRVAR statement.
Default: Each
distinct group value might be represented in the graph by a different
combination of line color and line pattern. Line colors vary according
to the GraphData1:ContrastColor - GraphDataN:ContrastColor style references,
and line patterns vary according to the GraphData1:LineStyle - GraphDataN:LineStyle
style references.
Interaction: The
group values are mapped in the order of the data, unless the INDEX= option is used to alter the default sequence of line colors
and line patterns.
Interaction: The
INCLUDEMISSINGGROUP option controls whether missing group values are
considered a distinct group value.
Tip:
The LINEATTRS= option can be used to override the
representations that are used to identify the groups. For example,
LINEATTRS=(PATTERN=SOLID) can be used to assign the same pattern to
all of the lines, letting the line color distinguish group values.
Likewise, LINEATTRS=(COLOR=BLACK) can be used to assign the same color
to all of the lines, letting the line pattern distinguish group values.
specifies whether missing
values of the group variable are included in the plot.
Tip:
Unless a discrete attribute map is in effect or the INDEX= option
is used, the attributes of the missing group value are determined
by the GraphMissing style element except when the MISSING= system
option is used to specify a non-default missing character or when
a user-defined format is applied to the missing group value. In those
cases, the attributes of the missing group value are determined by
a GraphData1–GraphDataN style element.
specifies indices for
mapping line attributes (color and pattern) to one of the GraphData1
- GranphDataN style elements.
Restriction: If
the value of the numeric-column is
missing or is less than 1, the observation is not used in the analysis.
If the value is not an integer, only the integer portion is used.
Interaction: All
of the indexes for a specific group value must be the same. Otherwise,
the results are unpredictable.
Interaction: The
index values are 1-based indices. For the style elements in GraphData1
- GraphDataN, if the index value is greater than N, then a modulo
operation remaps that index value to a number less than N to determine
which style element to use.
Discussion: Indexing
can be used to collapse the number of groups that are represented
in a graph. For more information, see Remapping Groups for Grouped Data.
specifies the attributes
of the line. See General Syntax for Attribute Options for the syntax
on using a style-element and Line Options for available line-options.
specifies whether data
are mapped to the primary X (bottom) axis or to the secondary X2 (top)
axis.
Interaction: The
overall plot specification and the layout type determine the axis
display. For more information, see How Axis Features Are Determined.
specifies whether data
are mapped to the primary Y (left) axis or to the secondary Y2 (right)
axis.
Interaction: The
overall plot specification and the layout type determine the axis
display. For more information, see How Axis Features Are Determined.