Example Program and Statement Details

Example Graph

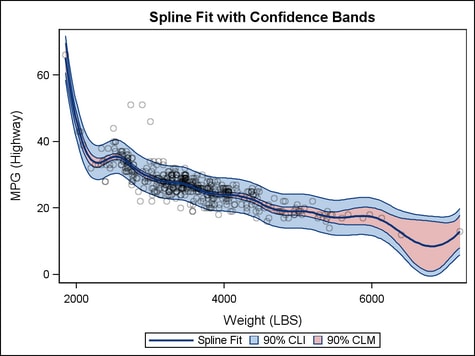
The following graph was generated by the Example Program:
Example Model Band Graph

Example Program

proc template;
 define statgraph modelband;
  begingraph;
   entrytitle "Spline Fit with Confidence Bands";
   layout overlay;
     modelband "cliband" / name="confband1" display=all
       legendlabel="90% CLI" fillattrs=GraphConfidence;
     modelband "clmband" / name="confband2" display=all
       legendlabel="90% CLM" fillattrs=GraphConfidence2;
     scatterplot x=weight y=mpg_highway /
       datatransparency=.7;
     pbsplineplot x=weight y=mpg_highway / name="fitline"
       clm="clmband" cli="cliband"
       alpha=.1 legendlabel="Spline Fit";
     discretelegend "fitline" "confband1" "confband2";
   endlayout;
  endgraph;
 end;
run;

proc sgrender data=sashelp.cars template=modelband;
run;

Statement Summary

A MODELBAND statement must be associated with a smoother statement (LOESSPLOT, REGRESSIONPLOT, or PBSPLINEPLOT) that specifies a fitted model and a type of confidence level to compute. The example program uses a PBSPLINEPLOT statement.

Required Arguments

"confidence-name"
specifies the case-sensitive name assigned to a confidence option in a smoother plot statement.
Requirement: confidence-name must have been assigned to the CLM= or CLI= option on a smoother plot statement such as LOESSPLOT, REGRESSIONPLOT, or PBSPLINEPLOT.

Options

Option
Description
Specifies the color and font attributes of the upper and lower band labels.
Specifies a label for the lower band limit.
Specifies a label for the upper band limit.
Specifies the location of the band labels relative to the plot area.
Specifies the position of the band label relative to the band line.
Specifies the degree of the transparency of the band fill and the band outline.
Specifies whether to display an outlined band area, a filled band area, or an outlined and filled band area.
Specifies the appearance of the filled band area.
Specifies a label for a legend.
Assigns a name to a plot statement for reference in other template statements.
Specifies the properties of the band lines.
Specifies display formats for information defined by roles.
Specifies display labels for information defined by roles.
Specifies whether data are mapped to the primary X (bottom) axis or the secondary X2 (top) axis.
Specifies whether data are mapped to the primary Y (left) axis or the secondary Y2 (right) axis.
CURVELABELATTRS=style-element | style-element (text-options) | (text-options)
specifies the color and font attributes of the upper and lower band labels. See General Syntax for Attribute Options for the syntax on using a style-element and Text Options for available text-options.
Default: The GraphValueText style element.
Interaction: For this option to take effect, the CURVELABELLOWER= or CURVELABELUPPER= option must also be specified.
Interaction: If the smoother statement’s GROUP= option is specified, this option is ignored.
CURVELABELLOWER="string"
specifies a label for the lower band limit.
Default: no curve label is displayed
Interaction: If the smoother statement’s GROUP= option is specified, this option is ignored.
The font and color attributes for the label are specified by the CURVELABELATTRS= option.
CURVELABELUPPER="string"
specifies a label for the upper band limit.
Default: no curve label is displayed
Interaction: If the smoother statement’s GROUP= option is specified, this option is ignored.
The font and color attributes for the label are specified by the CURVELABELATTRS= option.
CURVELABELLOCATION=INSIDE | OUTSIDE
specifies the location of the band labels relative to the plot area.
Default: INSIDE
INSIDE
inside the plot area
OUTSIDE
outside the plot area
Restriction: OUTSIDE cannot be used when the MODELBAND is used in multi-cell layouts such as LATTICE, DATAPANEL, or DATALATTICE, where axes might be external to the grid.
Interaction: This option is used in conjunction with the CURVELABELPOSITION= option to determine where the band labels appear. For more information, see Location and Position of Curve Labels.
Interaction: For this option to take effect, the CURVELABELLOWER= or CURVELABELUPPER= option must also be specified.
CURVELABELPOSITION=AUTO | MAX | MIN | START | END
specifies the position of the band label relative to the band line.
Default: AUTO when CUVELABELLOCATION=OUTSIDE. END when CURVELABELLOCATION=INSIDE
AUTO
Only used when CURVELABELPOSITION=OUTSIDE. Band labels are positioned automatically near the band boundary along unused axes whenever possible (typically Y2 and X2).
MAX
Forces the band label to appear near maximum band values (typically, upper right)
MIN
Forces the band label to appear near minimum band values (typically, lower left)
START
Only used when CURVELABELLOCATION=INSIDE. Forces the band label to appear near the beginning of the band. Particularly useful when the curve line has a spiral shape.
END
Only used when CURVELABELLOCATION=INSIDE. Forces the band label to appear near the end of the band. Particularly useful when the curve line has a spiral shape.
Interaction: For this option to take effect, the CURVELABELLOWER= or CURVELABELUPPER= option must also be specified.
Restriction: The AUTO setting is ignored if CURVELABELLOCATION=INSIDE is specified. The START and END settings are ignored if CURVELABELLOCATION=OUTSIDE is specified.
Interaction: This option is used in conjunction with the CURVELABELLOCATION= option to determine where the band label appears. For more information, see Location and Position of Curve Labels.
DATATRANSPARENCY=number
specifies the degree of the transparency of the band fill and the band outline.
Default: 0
Range: 0 (opaque) to 1 (entirely transparent)
Tip: The FILLATTRS= option can be used to set transparency for just the filled band area. You can combine this option with FILLATTRS= to set one transparency for the band outline but a different transparency for the band fill. Example:
datatransparency=0.2 fillattrs=(transparency=0.6)
DISPLAY=STANDARD | ALL | (display-options)
specifies whether to display an outlined area, a filled area, or an outlined and filled modelband area.
Default: The GraphBand:DisplayOpts style reference.
STANDARD
displays a filled band with no outlined
ALL
displays an outlined, filled band
(display-options)
a list of options, enclosed in parentheses, that must include one of the following:
OUTLINE displays an outlined band
FILL displays a filled band
Use the OUTLINEATTRS= and FILLATTRS= options to control the appearance of the band.
FILLATTRS=style-element | style-element (fill-options) | (fill-options)
specifies the appearance of the filled modelband area. See General Syntax for Attribute Options for the syntax on using a style-element and Fill Options for available fill-options.
Default:
  • For non-grouped data, the GraphConfidence:Color style reference.
  • For grouped data, the GraphData1:Color - GraphDataN:Color style references.
Interaction: For this option to have any effect, the fill must be enabled by the ODS style or the DISPLAY= option.
Tip: The DATATRANSPARENCY= option sets the transparency for band outline and the band fill. You can combine this option with DATATRANSPARENCY= to set one transparency for the band outline but a different transparency for the band fill. Example:
datatransparency=0.2 fillattrs=(transparency=0.6)
LEGENDLABEL= "string"
specifies a label for the legend item that is associated with this plot.
Default: The string specified on the NAME= option.
Restriction: This option applies only to an associated DISCRETELEGEND statement.
Interaction: The smoother statement’s GROUP= option overrides this option.
NAME="string"
assigns a name to a plot statement for reference in other template statements.
Default: no default
Restriction: The string is case sensitive, cannot contain spaces, and must define a unique name within the template.
Interaction: The string is used as the default legend label if the LEGENDLABEL= option is not used.
The specified name is used primarily in legend statements to coordinate the use of colors and line patterns between the graph and the legend.
OUTLINEATTRS=style-element | style-element (line-options) | (line-options)
specifies the attributes of the modelband outlines. See General Syntax for Attribute Options for the syntax on using a style-element and Line Options for available line-options.
Default:
  • For non-grouped data, the GraphConfidence style element.
  • For grouped data, the GraphData1: ContrastColor - GraphDataN:ContrastColor style references.
Interaction: If DISPLAY=(FILL), this option has no effect.
TIPFORMAT=(role-format-list)
specifies display formats for tip columns.
Default: The column format of the variable assigned to the role or BEST6. if no format is assigned to a numeric column.
(role-format-list)
a list of role-name = format pairs separated by blanks.
The role-names X, LIMITLOWER, LIMITUPPER, GROUP, and INDEX are available to indicate which tooltip values to format.
TIPFORMAT=(LIMITUPPER=5.3
 LIMITLOWER=5.3)
Requirement: To generate tooltips, you must include an ODS GRAPHICS ON statement that has the IMAGEMAP option specified, and write the graphs to the ODS HTML destination.
TIPLABEL=(role-label-list)
specifies display labels for tip columns.
Default: The column label or column name of the variable assigned to the role.
(role-label-list)
a list of role-name = "string" pairs separated by blanks.
The role-names X, LIMITLOWER, LIMITUPPER, GROUP, and INDEX are available to indicate which tooltip values to label.
TIPLABEL=(LIMITUPPER="90% CLM"
LIMITLOWER="90% CLM")
Requirement: To generate tooltips, you must include an ODS GRAPHICS ON statement that has the IMAGEMAP option specified, and write the graphs to the ODS HTML destination.
XAXIS=X | X2
specifies whether data are mapped to the primary X (bottom) axis or to the secondary X2 (top) axis.
Default: X
Interaction: The overall plot specification and the layout type determine the axis display. For more information, see How Axis Features Are Determined.
The setting for this option should be the same as for the smoother statement referenced by the confidence-name.
YAXIS=Y | Y2
specifies whether data are mapped to the primary Y (left) axis or to the secondary Y2 (right) axis.
Default: Y
Interaction: The overall plot specification and the layout type determine the axis display. For more information, see How Axis Features Are Determined.
The setting for this option should be the same as for the smoother statement referenced by the confidence-name.