Example Program and Statement Details
Example Program
proc template;
define statgraph continuouslegend;
begingraph;
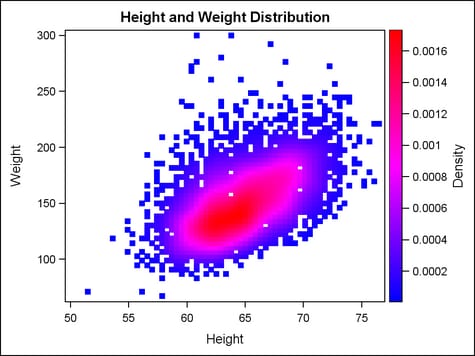
entrytitle "Height and Weight Distribution";
layout overlay;
scatterplot x=height y=weight /
markercolorgradient=density
markerattrs=(symbol=squarefilled size=6px)
name="scatter";
continuouslegend "scatter" / orient=vertical
location=outside valign=center halign=right
valuecounthint=10 title="Density";
endlayout;
endgraph;
end;
run;
proc sgrender data=sashelp.gridded(where=(count>0))
template=continuouslegend;
run;
Statement Summary
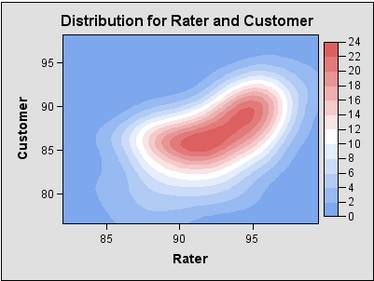
In the following figure,
the continuous legend references a contour plot with a fixed number
of levels. The color ramp and legend values automatically reflect
these discrete levels. The legend options VALUECOUNT= and VALUECOUNTHINT= have no effect.
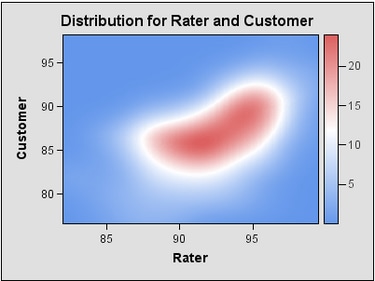
In this next figure,
the continuous legend references a contour plot with a continuous
gradient. The number of legend values displayed is automatically determined
by the legend, or decided by the contributing plot, such as the CONTOURPLOTPARM
with CONTOURTYPE=FILL. For plots with a continuous gradient, you can
use the legend options VALUECOUNT= or VALUECOUNTHINT= to control how many legend values
appear. (These options are ignored if there is no gradient.)
Within an overlay-type
layout, when a continuous legend is placed inside the plot area with LOCATION=INSIDE,
-
By default, its background is fully transparent (OPAQUE=FALSE), meaning that underlying lines, markers, and data labels show through the legend.
Options
specifies whether the
legend is automatically aligned within its parent layout when nested
within an overlay-type or region layout. For more information about
how child positions are determined in an overlay-type layout, see
the LAYOUT OVERLAY’s Statement Summary.
centers the legend
in the area that is farthest from any surrounding data point markers
within the parent layout. Available only if the parent layout contains
a scatter plot; ignored otherwise.
within the parent layout,
restricts the legend’s possible locations to those locations
in the specified location-list,
and uses the location-list position
that least collides with the parent layout’s other graphics
features. The location-list is
blank-separated and can contain any of these locations: TOPLEFT, TOP,
TOPRIGHT, LEFT, CENTER, RIGHT, BOTTOMLEFT, BOTTOM, and BOTTOMRIGHT.
specifies the attributes
of the border line around the legend. See General Syntax for Attribute Options for the syntax
on using a style-element and Line Options for available line-options.
specifies the horizontal
alignment of the legend within its parent layout when nested within
an overlay-type or region layout. For more information about how child
positions are determined in an overlay-type or region layout, see
the LAYOUT OVERLAY’s Statement Summary.
Range: A number specification
can range from 0 to 1. The number represents
a fraction of the parent container’s width, where 0 is all
the way to the left and 1 is all the way to the right.
Restriction: This
option is available only when this statement is nested within an overlay-type
or region layout. It is ignored if the parent layout is not an overlay-type
or region layout.
specifies whether the
legend appears inside or outside the plot area.
Restriction: This
option has effect only when the CONTINUOUSLEGEND statement appears
within a 2-D overlay-type layout and there is at least one stand-alone
plot statement with XY axes that is referenced by the legend. For
more information about how child positions are determined in an overlay-type
layout, see the LAYOUT OVERLAY’s Example Program and Statement Details.
Interaction: The
actual position is determined by the settings for the LOCATION=, AUTOALIGN=, HALIGN= , and VALIGN= options.
Interaction: If
this option is set to OUTSIDE, the HALIGN= and VALIGN= options must
specify a keyword (LEFT, RIGHT, or CENTER). The number setting
for the alignment is invalid when the legend is positioned outside
of the plot area.
Interaction: Within
an overlay-type layout, if the ORIENT= option is not set, the orientation changes depending on
the actual position. If LOCATION=OUTSIDE and the legend is right or
left of the plot, the orientation is vertical. If LOCATION=OUTSIDE
and the legend is above or below the plot, the orientation is horizontal.
specifies the amount
of extra space that is reserved inside the legend perimeter.
Default: The
default padding for all sides is 0. Values without units are in pixels
(px). A unit must be provided if other than pixels.
specifies a dimension
to use for the extra space at the left, right, top, and bottom of
the legend perimeter.
enables separate settings
for the left, right, top, and bottom padding dimensions. Use the pad-options to
create non-uniform padding. These options must be enclosed in parentheses.
Each option is specified as a name = value pair.
Sides not assigned padding are padded with the default amount.
| LEFT=dimension | specifies the amount of extra space added to the left side. |
| RIGHT=dimension | specifies the amount of extra space added to the right side. |
| TOP=dimension | specifies the amount of extra space added to the top. |
| BOTTOM=dimension | specifies the amount of extra space added to the bottom. |
specifies the color
and font attributes of the legend title. See General Syntax for Attribute Options for the syntax
on using a style-element and Text Options for available text-options.
specifies the vertical
alignment of the legend within its parent layout when nested within
an overlay-type or region layout. For more information about how child
positions are determined in an overlay-type or region layout, see
the LAYOUT OVERLAY’s Statement Summary.
Range: A number specification
can range from 0 to 1. The number represents
a fraction of the parent container’s height, where 0 is on
the bottom and 1 is on the top.
Restriction: This
option is available only when this statement is nested within an overlay-type
or region layout. It is ignored if the parent layout is not an overlay-type
or region layout.
specifies the color
and font attributes of the legend values. See General Syntax for Attribute Options for the syntax
on using a style-element and Text Options for available text-options.