Example Program and Statement Details
Example Program
proc template;
define statgraph regressionplot;
begingraph;
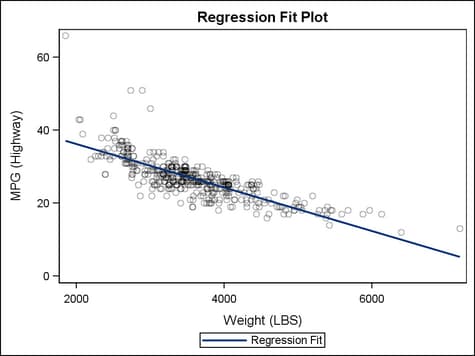
entrytitle "Regression Fit Plot";
layout overlay;
scatterplot x=weight y=mpg_highway /
datatransparency=.7;
regressionplot x=weight y=mpg_highway /
name="fitline"
alpha=.05 legendlabel="Regression Fit";
discretelegend "fitline";
endlayout;
endgraph;
end;
run;
proc sgrender data=sashelp.cars template=regressionplot;
run;
Statement Summary
The REGRESSIONPLOT statement
only supports models of one independent and one dependent variable.
For more information about the fitting methodology, see the TRANSREG
procedure in the SAS/STAT user’s guide.
Regression Options
produces confidence
limits for individual predicted values for each observation. The confidence
level is set by the ALPHA= option.
Interaction: name is
a unique name within the template that is case sensitive and cannot
contain spaces. It must be assigned in order for the confidence limits
to be computed. To display confidence limits, you must use this name
as the required argument of a MODELBAND statement. See the example
in Example Program and Statement Details.
produces confidence
limits for a mean predicted value for each observation. The confidence
level is set by the ALPHA= option.
Interaction: name is
a unique name within the template that is case sensitive and cannot
contain spaces. It must be assigned in order for the confidence limits
to be computed. To display confidence limits, you must use this name
as the required argument of a MODELBAND statement. See the example
in Example Program and Statement Details.
specifies a variable
in the input data set that represents the frequency of occurrence
of the current observation, essentially treating the data set as if
each observation appeared n times,
where n is the value of the
FREQ variable for the observation. Noninteger values of the FREQ variable
are truncated to the largest integer less than the FREQ value. The
observation is used in the analysis only if the value of the FREQ
variable is greater than or equal to 1.
Options
specifies a label for
the regression line.
The font and color
attributes for the label are specified by the CURVELABELATTRS= option.
specifies the color
and font attributes of the regression line labels. See General Syntax for Attribute Options for the syntax
on using a style-element and Text Options for available text-options.
specifies the location
of the regression line label relative to the plot area.
Restriction: OUTSIDE
cannot be used when the REGRESSIONPLOT is used in multi-cell layouts
such as LATTICE, DATAPANEL, or DATALATTICE, where axes might be external
to the grid.
Interaction: This
option is used in conjunction with the CURVELABELPOSITION= option to determine where the line
labels appear. For more information, see Location and Position of Curve Labels.
specifies the position
of the regression line label relative to the regression line.
Only used when CURVELABELLOCATION=OUTSIDE. The line label is positioned
automatically near the line boundary along unused axes whenever possible
(typically Y2 and X2) to avoid collision with tick values.
Restriction: The
AUTO setting is ignored if CURVELABELLOCATION=INSIDE is specified.
The START and END settings are ignored if CURVELABELLOCATION=OUTSIDE
is specified.
Interaction: This
option is used in conjunction with the CURVELABELLOCATION= option
to determine where the line label appears. For more information, see Location and Position of Curve Labels.
creates a distinct
set of regression lines from just the observations that correspond
to each unique group value of the specified column.
specifies
a discrete attribute variable that is defined in a DISCRETEATTRVAR statement.
Default: Each
distinct group value might be represented in the graph by a different
combination of line color and line pattern. Line colors vary according
to the GraphData1:ContrastColor–GraphDataN:ContrastColor style
references, and line patterns vary according to the GraphData1:LineStyle–GraphDataN:LineStyle
style references.
Interaction: The
group values are mapped in the order of the data, unless the INDEX= option is used to alter the default sequence of line colors
and line patterns.
Interaction: The
INCLUDEMISSINGGROUP option controls whether missing group values are
considered a distinct group value.
Tip: The LINEATTRS= option can be used to override the
representations that are used to identify the groups. For example,
LINEATTRS=(PATTERN=SOLID) can be used to assign the same pattern to
all of the lines, letting the line color distinguish group values.
Likewise, LINEATTRS=(COLOR=BLACK) can be used to assign the same color
to all of the lines, letting the line pattern distinguish group values.
specifies whether missing
values of the group variable are included in the plot.
Tip:
Unless a discrete attribute map is in effect or the INDEX= option
is used, the attributes of the missing group value are determined
by the GraphMissing style element except when the MISSING= system
option is used to specify a non-default missing character or when
a user-defined format is applied to the missing group value. In those
cases, the attributes of the missing group value are determined by
a GraphData1–GraphDataN style element.
specifies indices for
mapping line attributes (color and pattern) to one of the GraphData1–GraphDataN
style elements.
Restriction: If
the value of the numeric-column is
missing or is less than 1, the observation is not used in the analysis.
If the value is not an integer, only the integer portion is used.
Interaction: All
of the indexes for a specific group value must be the same. Otherwise,
the results are unpredictable.
Interaction: The
index values are 1-based indices. For the style elements in GraphData1–GraphDataN,
if the index value is greater than N, then a modulo operation remaps
that index value to a number less than N to determine which style
element to use.
Discussion: Indexing
can be used to collapse the number of groups that are represented
in a graph. For more information, see Remapping Groups for Grouped Data.
specifies the attributes
of the regression line. See General Syntax for Attribute Options for the syntax
on using a style-element and Line Options for available line-options.
specifies that the
data columns for this plot and the plot type be used for determining
default axis features.
Details: This
option is needed only when two or more plots within an overlay-type
layout contribute to a common axis. For more information, see When Plots Share Data and a Common Axis.
specifies display formats
for tip columns.
Default: The
column format of the variable assigned to the role or BEST6. if no
format is assigned to a numeric column.
specifies whether data
are mapped to the primary X (bottom) axis or to the secondary X2 (top)
axis.
Interaction: The
overall plot specification and the layout type determine the axis
display. For more information, see How Axis Features Are Determined.
specifies whether data
are mapped to the primary Y (left) axis or to the secondary Y2 (right)
axis.
Interaction: The
overall plot specification and the layout type determine the axis
display. For more information, see How Axis Features Are Determined.