Example Program and Statement Details
Example Program
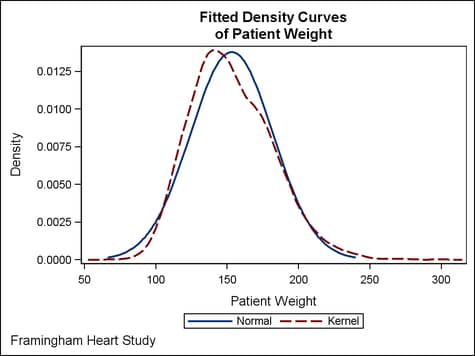
When used as a stand-alone
plot or overlaid with other density plots, the dependent axis shows
the computed density values.
proc template;
  define statgraph densityplot1;
    begingraph;
      entrytitle "Fitted Density Curves";
      entrytitle "of Patient Weight";
      entryfootnote halign=left "Framingham Heart Study";
      layout overlay;
        densityplot weight / normal()
         lineattrs=graphfit name="n" legendlabel="Normal";
        densityplot weight / kernel()
         lineattrs=graphfit2 name="k" legendlabel="Kernel";
        discretelegend "n" "k";
      endlayout;
    endgraph;
  end;
run;
proc sgrender data=sashelp.heart template=densityplot1;
  label weight="Patient Weight";
run;
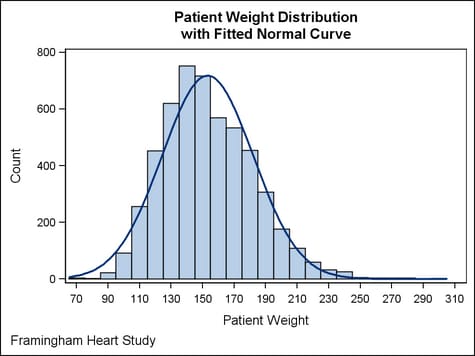
When one or more density
plots are overlaid on a histogram, the dependent axis shows the statistic
indicated by the histogram’s SCALE= option. The area under
each density curve is equal to the area of the histogram.
proc template;
  define statgraph densityplot2;
    begingraph;
	  entrytitle "Patient Weight Distribution";
      entrytitle "with Fitted Normal Curve";
      entryfootnote halign=left "Framingham Heart Study";
      layout overlay;
        histogram weight / primary=true scale=count;
        densityplot weight / normal() lineattrs=graphfit;
      endlayout;
    endgraph;
  end;
run;
proc sgrender data=sashelp.heart template=densityplot2;
  label weight="Patient Weight";
run;
Statement Summary
A typical DENSITYPLOT
statement specifies either the NORMAL or the KERNEL distribution option.
If no distribution option is specified, the NORMAL() option is used.
The following syntax explicitly shows the default case:
DENSITYPLOT numeric-column / NORMAL()
Distribution Options
specifies a nonparametric
kernel density estimate. The general form of the kernel density estimator
is as follows.
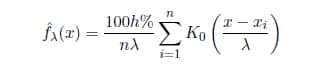
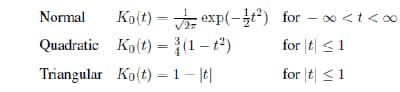
In the equation,  is the weight function,
  is the bandwidth, is the sample size, and
  is the ith
observation. You can use the C= suboption to specify the bandwidth
and the WEIGHT= suboption to specify the weight function .
is the ith
observation. You can use the C= suboption to specify the bandwidth
and the WEIGHT= suboption to specify the weight function .
is the weight function, is the bandwidth, is the sample size, and is the ith
observation. You can use the C= suboption to specify the bandwidth
and the WEIGHT= suboption to specify the weight function .
For more information,
see the discussion of Kernel Density Estimates for the UNIVARIATE
procedure in the documentation for Base SAS.
specifies a positive
number (0 < number <=
100) that represents the standardized bandwidth.
Default: Calculated
from the data as the bandwidth that minimizes the approximate mean
integrated square error (MISE).
The value of , referred to as the bandwidth parameter, determines
the degree of smoothness in the estimated density function. You specify indirectly by specifying a standardized bandwidth c with
the C= kernel-option. If Q is
the interquartile range and n is
the sample size, then c is
related to by the following formula:
, referred to as the bandwidth parameter, determines
the degree of smoothness in the estimated density function. You specify indirectly by specifying a standardized bandwidth c with
the C= kernel-option. If Q is
the interquartile range and n is
the sample size, then c is
related to by the following formula:

specifies a normal
density estimate, with mean and standard deviation. The fitted density
function equation is as follows:
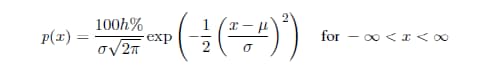
In the equation,  is the mean and
  is the standard deviation (
 ). You can specify with the MU= suboption and with the SIGMA= suboption. By default, ODS estimates with the sample mean and with the sample standard deviation.
is the mean and is the standard deviation (). You can specify with the MU= suboption and with the SIGMA= suboption. By default, ODS estimates with the sample mean and with the sample standard deviation.
Options
specifies the color
and font attributes of the density curve label. See General Syntax for Attribute Options for the syntax
on using a style-element and Text Options for available text-options.
specifies the location
of the density curve label relative to the plot area.
Restriction: OUTSIDE
cannot be used when the DENSITYPLOT is used in multi-cell layouts
such as LATTICE, DATAPANEL, or DATALATTICE, where axes can be external
to the grid.
Interaction: This
option is used in conjunction with the CURVELABELPOSITION= option to determine where the curve
label appears. For more information, see Location and Position of Curve Labels.
Specifies the position
of the density curve label relative to the curve line.
Only used when CURVELABELPOSITION=OUTSIDE.
The density label is positioned automatically near the end of the
density curve along unused axes whenever possible (typically Y2 or
X2) to avoid collision with tick values.
Restriction: The
AUTO setting is ignored if CURVELABELLOCATION=INSIDE is specified.
The START and END settings are ignored if CURVELABELLOCATION=OUTSIDE
is specified.
Interaction: This
option is used in conjunction with the CURVELABELLOCATION= option to determine where the density
label appears. For more information, see Location and Position of Curve Labels.
specifies a numeric
column that provides frequencies for each observation read. If n is
the value of thenumeric-column given
observation, then that observation is used n times
in computing the density curve.
specifies the attributes
of the density curve. See General Syntax for Attribute Options for the syntax
on using a style-element and Line Options for available line-options.
specifies that the
data columns for this plot and the plot type be used for determining
default axis features.
Details: This
option is needed only when two or more plots within an overlay-type
layout contribute to a common axis. For more information, see When Plots Share Data and a Common Axis.
specifies display labels
for the tooltips that are displayed when the cursor is positioned
over the density curve.
specifies whether data
are mapped to the primary X (bottom) axis or to the secondary X2 (top)
axis.
Interaction: The
overall plot specification and the layout type determine the axis
display for the specified axis. For more information, see How Axis Features Are Determined.
specifies whether data
are mapped to the primary Y (left) axis or to the secondary Y2 (right)
axis.
Interaction: The
overall plot specification and the layout type determine the axis
display for the specified axis. For more information, see How Axis Features Are Determined.