Example Program and Statement Details
Example Program
proc template;
define statgraph layoutoverlayequated;
begingraph;
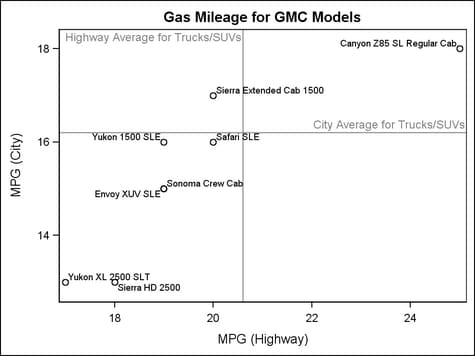
entrytitle "Gas Mileage for GMC Models";
layout overlayequated / equatetype=fit;
referenceline y=16.2 /
curvelabel="City Average for Trucks/SUVs"
curvelabellocation=inside
curvelabelattrs=GraphReference;
referenceline x=20.6 /
curvelabel="Highway Average for Trucks/SUVs"
curvelabellocation=inside
curvelabelattrs=GraphReference;
scatterplot x=mpg_highway y=mpg_city /
datalabel=model;
endlayout;
endgraph;
end;
run;
proc sgrender data=sashelp.cars
template=layoutoverlayequated;
where make="GMC";
run;
Statement Summary
The LAYOUT OVERLAYEQUATED
statement is similar to the LAYOUT OVERLAY statement: it builds a
composite using one or more GTL-statements. Similar to a LAYOUT OVERLAY, you can specify one or more 2-D plots
within the layout, provided all plots can share the same type of axes.
(Additional restrictions are discussed in a moment.) You can also
specify one or more insets.
As an overlay-type layout,
OVERLAYEQUATED has the same behavioral characteristics as an OVERLAY
layout. It uses the same general logic for rendering the composite
(see LAYOUT OVERLAY Statement for details),
and its default axis characteristics are generally determined by the
first specified plot, unless you use PRIMARY=TRUE on an alternative
plot statement (see When Plots Share Data and a Common Axis).
-
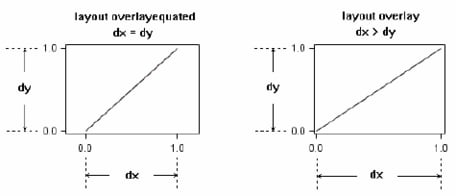
The aspect ratio of the plot display equals the aspect ratio of the plot data. In other words, a 45 degree slope in data is represented by a 45 degree slope in the display. The EQUATETYPE= option determines how the axes are drawn.
The following figure
illustrates how a series plot might map differently when specified
in an OVERLAYEQUATED layout versus an OVERLAY layout:
A LAYOUT OVERLAYEQUATED
statement enables you to specify one or more of the following XY plots:
SCATTERPLOT, SERIESPLOT, NEEDLEPLOT, STEPPLOT, VECTORPLOT, BANDPLOT,
LOESSPLOT, REGRESSIONPLOT, PBSPLINEPLOT, and CONTOURPLOTPARM. As long
as one of these plots is present, you can also add FRINGEPLOT, LINEPARM,
MODELBAND, REFERENCELINE, DROPLINE, and insets as ENTRY, DISCRETELEGEND,
and CONTINUOUSLEGEND.
From a data standpoint,
this layout has only two independent axes, X and Y. If any plots within
the layout block use an XAXIS=X2 or YAXIS=Y2 option, the option is
ignored and the data are mapped to the X or Y axis. To display X2
and Y2 axes, use the DISPLAYSECONDARY= suboption of the XAXISOPTS=
and YAXISOPTS= options.
Options
specifies the attributes
of the border line around the layout. See General Syntax for Attribute Options for the syntax
on using a style-element and Line Options for available line-options.
specifies one or more
axis options to be applied to all displayed axes. For a list of options,
see Options That Apply in Common to Both Equated Axes.
specifies whether the
default visual attributes of markers, lines, and fills in nested plot
statements automatically change from plot to plot. See Cycling through Group Attributes in Overlaid Plots for more information.
does not cycle the
default visual attributes of multiple plots. For example, if you overlay
three series plots, each series line has the same default visual properties.
the system looks at
the plots in the layout. It tries to use the GraphData1 - GraphDataN
style elements to assign different visual properties to applicable
plots (scatter plots and series plots and others). For example, if
you overlay three series plots, the three series lines receive different
default visual properties (line pattern and color). These default
properties are determined by the next GraphDataN style element not
already used. Some plots in the layout do not participate in the cycling
(for example, reference lines and drop lines).
specifies how to draw
the axis area.
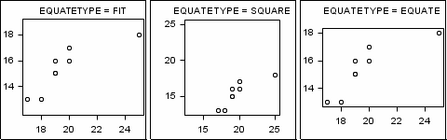
X and Y axes have equal
increments between tick values. The data ranges of both axes are compared
to establish a common increment size. The axes might be of different
lengths and have a different number of tick marks. Each axis represents
its own data range. One axis might be extended to use available space
in the plot area. If a TICKVALUELIST= or TICKVALUESEQUENCE= axis option
is used on COMMONAXISOPTS=, it is ignored.
specifies the amount
of extra space that is added inside the layout border.
Default: The default padding for all sides is 0. Values without units are
in pixels (px). A unit must be provided if other than pixels.
Enables separate settings
for the left, right, top, and bottom padding dimensions. Use the pad-options to create non-uniform padding. These
options must be enclosed in parentheses. Each option is specified
as a name = value pair. Sides
not assigned padding are padded with the default amount.
| LEFT=dimension | specifies the amount of extra space added to the left side. |
| RIGHT=dimension | specifies the amount of extra space added to the right side. |
| TOP=dimension | specifies the amount of extra space added to the top. |
| BOTTOM=dimension | specifies the amount of extra space added to the bottom. |
specifies whether the
plot’s wall and wall outline are displayed.
Use the WALLCOLOR= option to control the fill color
of the wall.
specifies one or more
X axis options. For a list of options, see Options That Apply Separately to an X or Y Equated Axis.
specifies one or more
Y axis options. For a list of options, see Options That Apply Separately to an X or Y Equated Axis.