Example Program and Statement Details
Overview
The LAYOUT OVERLAYEQUATED
statement is used for equated layouts where the X and Y axes always
have equal increments between tick values. Because the axes within
the equated layout are so closely correlated, some axis adjustments
cannot be applied to one axis without applying them to the other.
For example, the INTEGER=
option sets evenly spaced integer values for the axis tick marks.
That setting must be applied to both axes if the correlation between
them is to be maintained. The LAYOUT OVERLAYEQUATED statement provides
the COMMONAXISOPTS= option for specifying the INTEGER=
option and other options whose settings apply in common to both axes.
Despite the close correlation
between the axes, some axis adjustments can be made to one axis without
affecting the other. For example, displaying grid lines on one axis
has no impact on the other. The XAXISOPTS= and YAXISOPTS= options are available for applying
settings separately to the X and Y axes.
The following example
template sets evenly spaced integer values for the axis tick marks
of both axes. It also specifies the display of grid lines, tick marks,
and tick values for the Y axis:
begingraph;
  layout overlayequated /
    commonaxisopts=(integer=true);
    yaxisopts=(griddisplay=on display=(ticks tickvalues));
    seriesplot x=var1 y=var2;
  endlayout;
endgraph;
Interaction. The
OVERLAYEQUATED’s axis options are ignored when the LAYOUT OVERLAYEQUATED
statement is nested within another layout type that has external axes
in effect. For example, the axis options are ignored when the statement
is nested within a LAYOUT LATTICE with a COLUMNAXIS= or ROWAXIS= option
in effect.
Options That Apply in Common to Both Equated Axes
The options that are
documented in this section are applied to both axes and cannot be
applied separately to an X or Y axis. See Options That Apply Separately to an X or Y Equated Axis for a list
of options that can be applied to a single axis.
specifies that evenly
spaced integer values are used for tick marks for all axes.
Interaction: This
option overrides the MAXDECIMALS= and PREFERREDDECIMALS= suboptions
of the TICKVALUEFORMAT= option on XAXISOPTS= or YAXISOPTS=.
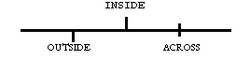
specifies the placement
of tick marks in relation to the axis line. The figure shows the tick
display on an X axis.
Interaction: This
option is ignored if the ticks are not displayed. See the DISPLAY= and DISPLAYSECONDARY= suboptions of XAXISOPTS= and YAXISOPTS=.
specifies the tick
values as a list.
Default: An
internal algorithm determines the tick marks based on the actual axis
data range or the data range established by the VIEWMIN= and VIEWMAX= options. By default when this option
is used, the only tick values that appear are the numeric-list tick
values that fall within the explicit data range (set by VIEWMIN= and
VIEWMAX=) or implicit data range (set by the actual data minimum and
data maximum).
Interaction: This
option is ignored if the LAYOUT OVERLAYEQUATED statement specifies
EQUATETYPE=FIT (the default).
Interaction: This
option is ignored if the TICKVALUESEQUENCE= option is specified, or if the DISPLAY= option does not display tick values.
Interaction: The VIEWMIN= and VIEWMAX= options alter the axis data range. If
the VIEWMIN= option is set to the minimum tick list value and the
VIEWMAX= option is set to the maximum tick list value, all ticks in
the tick list are displayed.
Interaction: If
the TICKVALUEPRIORITY= is set to TRUE, 1) the VIEWMIN= and
VIEWMAX= options are ignored if they are fully enclosed by the numeric-list 2)
the tick numeric-list can extend
the implicit data range of the axis, but never reduce it.
The values in the
list are formatted according to the setting for the TICKVALUEFORMAT= option on XAXISOPTS= or YAXISOPTS=.
specifies the tick
values by start, end, and increment.
Default: An
internal algorithm determines the tick marks based on the actual axis
data range or the data range established by the VIEWMIN= and VIEWMAX= options. By default when this option
is used, the only tick values that appear are those that fall within
the explicit data range (set by VIEWMIN= and VIEWMAX=) or implicit
data range (set by the actual data minimum and data maximum).
Three options that
control tick values. All three options must be provided.
| START = number | Specifies the value for the first tick mark. |
| END = number | Specifies the value for the last tick mark. |
| INCREMENT = number | Specifies the increment for intermediate tick marks between the first and last tick marks. The END value always controls the last tick mark. The interval between the last tick mark and the previous tick mark might not necessarily be the INCREMENT value. |
Interaction: This
option is ignored if the LAYOUT OVERLAYEQUATED statement specifies
EQUATETYPE=FIT (the default), or if the DISPLAY= option does not display tick marks.
Interaction: The
VIEWMIN= and VIEWMAX= options alter the axis data range. If the VIEWMIN=
option is set to the START= option value and the VIEWMAX= option is
set to the END= option value, all ticks in the tick sequence are displayed.
Interaction: If
the TICKVALUEPRIORITY= option is set to TRUE, the tick sequence
might extend the explicit data range of the axis, but never reduce
it.
The values in the
sequence are formatted according to the setting for the TICKVALUEFORMAT= option on XAXISOPTS= or YAXISOPTS=.
specifies the maximum
data value to include in the display (the value might be adjusted
by the threshold calculation). For more information, see Adjusting the Axis View.
Interaction: This
option does not determine the maximum axis tick value displayed. The THRESHOLDMAX= value is used to determine the maximum
tick value.
specifies the minimum
data value to include in the display (the value might be adjusted
by the threshold calculation). For more information, see Adjusting the Axis View.
Interaction: This
option does not determine the minimum axis tick value displayed. The THRESHOLDMIN= value is used to determine the maximum
tick value.
Options That Apply Separately to an X or Y Equated Axis
The options that are
documented in this section can be applied to an X axis with the XAXISOPTS=
option, or to the Y axis with the YAXISOPTS= option. See Options That Apply in Common to Both Equated Axes for a list
of options that apply in common to both axes.
controls which axis
features are displayed on the secondary axis. When data are mapped
to the X or Y axis, you can display an X2 or Y2 (secondary) axis using
this option. The secondary axis is a duplicate of the X or Y axis
but can have different display options.
specifies the attributes
of the grid lines. See General Syntax for Attribute Options for the syntax on using a style-element and Line Options for available line-options.
specifies when axis
grid lines are displayed.
specifies that grid
lines are not displayed unless the GraphGridLines element in the current
style contains DisplayOpts="ON."
This option enables
the template to absolutely control the display of grid lines or to
allow interaction with the current style to decide whether grid lines
are displayed.
Supplied styles use
DisplayOpts="AUTO," which means that the style has no "preference"
about grid lines and the graphics template setting for grid lines
is always used.
Discussion: The
following table shows the end results for various combinations of
the GRIDDISPLAY= option and the DisplayOpts= attribute of the GraphGridLines
style element. Most supplied templates use the default setting AUTO_OFF
to indicate a preference for not displaying grid lines, but allowing
the style to override.
specifies the axis
label. The string can be either
a string literal or a dynamic. The list form implies that all included
string literals or dynamics will be concatenated
Default: The
default label is derived from the primary plot in the layout. For
more information, see When Plots Share Data and a Common Axis.
Interaction: If
the axis label is too long to fit along the axis, it is truncated
by default. Use the SHORTLABEL= option to specify an alternate axis
label to be used whenever truncation would normally occur.
specifies the color
and font attributes of the axis label. See General Syntax for Attribute Options for the syntax
on using a style-element and Text Options for available text-options.
reserves an area at
the maximum end of the axis. No tick marks are displayed in the reserved
area. For more information, see Adjusting Axis Offsets.
reserves an area at
the minimum end of the axis. No tick marks are displayed in the reserved
area. For more information, see Adjusting Axis Offsets.
specifies whether the
tick values should appear in the reverse order.
Note: This feature is
for the second maintenance release of SAS 9.3 and later. See What's New in the SAS 9.3 Graph Template Language.
specifies an alternate
axis label. This label is used when the default axis label or label
specified by the LABEL= option is too long for the axis length.
specifies a bias for
including one more tick mark at the maximum end of the axis. For more
information, see Adjusting Axis Thresholds.
specifies a bias for
including one more tick mark at the minimum end of the axis. For more
information, see Adjusting Axis Thresholds.
specifies the color
and font attributes of the axis tick values. See General Syntax for Attribute Options for the syntax
on using a style-element and Text Options for available text-options.
specifies an ordered
list of strategies to avoid tick value collision. Only the default
setting (THIN) is available for a Y or Y2 axis.
The collision-avoidance
policy that is most effective depends on the number of tick values,
their length, and the length of the axis. For an X or X2 axis, the
policy can be one of the following:
specifies how to format
the values for tick marks.
specifies one or more
tick value formatting options. Together, these options provide parameters
for determining an optimal format (w.d,
Ew., BESTw.)
for displaying tick values.
| MAXWIDTH = integer | Specifies the maximum width for displayed tick values. Values might be rounded or converted to E notation to fit into this width. |
| MAXDECIMALS = integer | Specifies the maximum number of decimals for displayed tick values. Values might be rounded or converted to E notation to fit into this width. MAXWIDTH > MAXDECIMALS |
| PREFERREDDECIMALS = integer | Specifies the number of decimal places desired for most values. The actual number might vary based on other constraints. |
| EXTRACTSCALE = boolean | Specifies whether to extract a scale factor from the tick values and use it to reduce the tick value width. For large tick values, the scale factor is set to ensure that the absolute value of the largest value is greater than 1. The scale can be millions, billions, or trillions for values of 999 trillion or less, or a multiple of 10 (denoted as 10^n) for values over 999 trillion. For small fractional tick values, the scale factor is set to ensure that the absolute value of the smallest value is greater than 1. The scale can be millionth, billionth, or trillionth for values of 1 trillionth or more, or a multiple of 1/10 (10^–n) for values less than 1 trillionth. The scale used is appended to the axis label. For example: Total Sales (millions). |
Restriction: GTL
currently honors most but not every SAS format. For details, see SAS Formats Not Supported.