Example Program and Statement Details

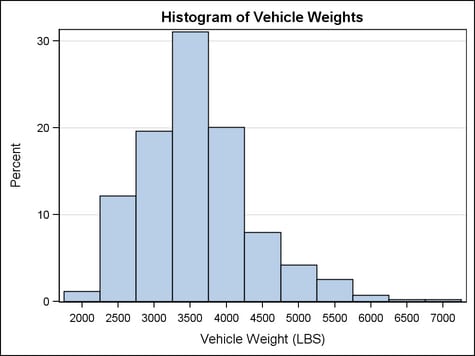
Example Graph

The following graph was generated by the Example Program:
Example Histogram

Example Program

proc template;
  define statgraph histogram;
    begingraph;
      entrytitle "Histogram of Vehicle Weights";
      layout overlay /
        xaxisopts=(label="Vehicle Weight (LBS)")
        yaxisopts=(griddisplay=on);
        histogram weight;
      endlayout;	   
    endgraph;
  end;
run;

proc sgrender data=sashelp.cars template=histogram;
run;

Statement Summary

The Histogram’s default bin width is computed by using the number of observations and the range of the data. When a curve is overlaid on the histogram, the histogram’s bin width is used to scale the curve so that the area under the curve is equal to the area of the histogram.

Required Arguments

numeric-column
specifies a variable that contains numeric values, or a dynamic variable that refers to such a variable.
expression
specifies an expression that calculates values when those values are not stored in the data.

Options

Statement Option
Description
Specifies whether to use bins as the basis for X axis tick marks.
Specifies the X coordinate of the first bin.
Specifies the bin width.
Specifies how a boundary is counted when it lies on the endpoint of a bin.
Specifies the degree of the transparency of the bars.
Specifies whether to display outlined bars, filled bars, or outlined and filled bars.
Specifies whether axis ticks and value labels are drawn at the endpoints of the bins or the midpoints of the bins.
Specifies the appearance of the interior fill area of the bars.
Specifies a column that indicates a frequency count for each observation of the input data object.
Specifies a label for use in a legend.
Assigns a name to a plot statement for reference in other template statements.
Specifies the number of bins.
Specifies the orientation of the Y axis and the bars.
Specifies the line properties of the bar outlines.
Specifies that the data columns for this plot be used for determining default axis features.
Specifies whether the Y axis displays the percentages between 0 and 100, the frequency counts, or the proportions between 0 and 1.
Specifies display formats for tip columns.
Specifies display labels for information defined by roles.
Specifies whether data are mapped to the primary X (bottom) axis or the secondary X2 (top) axis.
Specifies whether the X values represent lower endpoints, midpoints, or upper endpoints of the bins.
Specifies whether data are mapped to the primary Y (left) axis or the secondary Y2 (right) axis.
BINAXIS=boolean
Specifies whether to use bins as the basis for axis tick marks.
Default: TRUE
FALSE
The ENDLABELS= option is ignored. A standard axis is used, ignoring bin boundaries and midpoints.
TRUE
The ENDLABELS= option determines how the axis ticks and value labels are displayed. The axis ticks are in predetermined locations and cannot be changed with axis suboptions such TICKVALUELIST= and TICKVALUESEQUENCE=.
Interaction: When this option is set to TRUE, some X-axis options that are set on the parent layout might not apply.
Interaction: This option is ignored if this HISTOGRAM is not the primary plot (for more information about primary plots, see When Plots Share Data and a Common Axis).
BINSTART=number
specifies the X coordinate of the first bin. Use this option in conjunction with the BINWIDTH= or NBINS= options to specify bins. If neither BINWIDTH= nor the NBINS= option is specified, the system determines the number of bins. If the BINSTART value results in excluding the entire range of data, it is ignored and the default BINSTART value is used.
Default: Determined by the system.
See also: XVALUES= option
BINWIDTH=number
specifies the bin width. The system determines the number of bins. The bins always span the range of the data.
Default: Determined by the system.
Interaction: This option is ignored if the NBINS= option is also specified
BOUNDARY=UPPER | LOWER
specifies how a boundary is counted when it lies on the endpoint of a bin. If this option is set to UPPER, then the value is counted as one of the values in the upper bin (the bin to the right). Otherwise, it is counted in the lower bin.
Default: UPPER
DATATRANSPARENCY=number
specifies the degree of the transparency of the bars (outline and fill).
Default: 0
Range: 0 (opaque) to 1 (entirely transparent)
DISPLAY=STANDARD | ALL | ( display-options )
specifies whether to display outlined bars, filled bars, or outlined and filled bars.
Default: The GraphHistogram:DisplayOpts style reference.
STANDARD
displays outlined, filled bars
ALL
displays outlined, filled bars
(display-options)
a list of comma-separated options enclosed in parentheses. Any of the options from the OUTLINEATTRS= and FILLATTRS= options can be used. The specified list must include one of the following:
OUTLINE—displays outlined bars
FILL—displays filled bars
Use the OUTLINEATTRS= and FILLATTRS= options to control the appearance of the bars.
ENDLABELS=boolean
specifies whether the axis ticks and value labels are drawn at the bin endpoints or bin midpoints.
Default: FALSE
Interaction: If this option is set to FALSE, then the axis ticks and value labels are drawn at the bin midpoints, whether the XVALUES= option identifies the X data as endpoint values or midpoint values.
Interaction: If BINAXIS=FALSE or this HISTOGRAM is not the primary plot, then this option is ignored.
FILLATTRS=style-element | style-element (fill-options) | (fill-options)
specifies the appearance of the interior fill area of the bars. See General Syntax for Attribute Options for the syntax on using a style-element and Fill Options for available fill-options.
Default: The GraphDataDefault style element
Interaction: For this option to have any effect, the fill must be enabled by the ODS style or the DISPLAY= option.
FREQ=numeric-column | expression
specifies a column that indicates a frequency count for each observation of the input data object. If n is the value of the FREQ variable for a given observation, then that observation is plotted n times.
Default: Each observation has a frequency count of 1.
Restriction: If the value of the numeric-column is missing or is less than 1, the observation is not used in the analysis. If the value is not an integer, only the integer portion is used.
LEGENDLABEL= "string"
specifies a label for use in a legend.
Default: The string specified on the NAME= option.
NAME= "string"
assigns a name to a plot statement for reference in other template statements.
Default: no default
Restriction: The string is case sensitive, cannot contain spaces, and must define a unique name within the template.
Interaction: The string is used as the default legend label if the LEGENDLABEL= option is not used.
The specified name is used primarily in legend statements to coordinate the use of colors and line patterns between the graph and the legend.
NBINS=integer
specifies the number of bins. The system determines the BINWIDTH= value. The bins always span the range of the data.
Default: Determined by the system.
ORIENT=VERTICAL | HORIZONTAL
specifies the orientation of the Y axis and the bars.
Default: VERTICAL
OUTLINEATTRS=style-element | style-element (line-options) | (line-options)
specifies the line properties of the bar outlines. See General Syntax for Attribute Options for the syntax on using a style-element and Line Options for available line-options.
Default: The GraphDataDefault style element.
Interaction: For this option to have any effect, the outlines must be enabled by the ODS style or the DISPLAY= option.
PRIMARY=boolean
specifies that the data columns for this plot be used for determining default axis features.
Default: FALSE
Restriction: This option is ignored if the plot is placed under a GRIDDED or LATTICE layout block.
Details: This option is needed only when two or more plots within an overlay-type layout contribute to a common axis. For more information, see SECTION ON SHARED DATA
SCALE=PERCENT | COUNT | PROPORTION
specifies whether the Y axis displays the percentages between 0 and 100, or the frequency counts, or the proportions between 0 and 1.
Default: PERCENT
TIPFORMAT=(role-format-list)
specifies display formats for tip columns.
Default: The column format of the variable assigned to the role or BEST6. if no format is assigned to a numeric column. The X role represents the binned value. The Y role represents the computed amount of X in the units specified by the SCALE= option.
(role-format-list)
a list of rolename = format pairs separated by blanks.
  TIPFORMAT=( Y=PERCENT7.2) 
Requirement: To generate tooltips, you must include an ODS GRAPHICS ON statement that has the IMAGEMAP option specified, and write the graphs to the ODS HTML destination.
TIPLABEL=(role-label-list)
specifies display labels for tip columns.
Default: The column label or column name of the variable assigned to the role. The X role represents the binned value. The Y role represents the computed amount of X in the units specified by the SCALE= option.
(role-label-list)
a list of rolename = "string" pairs separated by blanks.
   TIPLABEL=( Y="Percent")
Requirement: To generate tooltips, you must include an ODS GRAPHICS ON statement that has the IMAGEMAP option specified, and write the graphs to the ODS HTML destination.
XAXIS=X | X2
specifies whether data are mapped to the primary X (bottom) axis or to the secondary X2 (top) axis.
Default: X
Interaction: The overall plot specification and the layout type determine the axis display. For more information, see How Axis Features are Determined.
XVALUES=MIDPOINTS | LEFTPOINTS | RIGHTPOINTS
specifies whether the X values represent lower endpoints, midpoints, or upper endpoints of the bins. For example, if BINSTART=10 and BINWIDTH=10, using LEFTPOINTS would result in bins 10 - 20, 20 - 30, and so on. Using RIGHTPOINTS would result in bins 0 - 10, 10 - 20, ...., and using MIDPOINTS would result in bins 5 - 15, 15 - 25, ... .
Default: MIDPOINTS
YAXIS=Y | Y2
specifies whether data are mapped to the primary Y (left) axis or to the secondary Y2 (right) axis.
Default: Y
Interaction: The overall plot specification and the layout type determine the axis display. For more information, see How Axis Features are Determined.