How Axis Features are Determined
Overview
The GTL
uses various criteria to determine the displayed axis features for
a graph. Generally, axis features are based on the layout type, the
order of plot statements in the layout and the options specified on
those statements, the use of primary and secondary axes on the plots
(when secondary axes are supported), the plot type, the column(s)
of data that contribute to defining the axis range, and the data formats
for the contributing data columns.
Plot Data Are Mapped to a Designated Axis
Depending
on the layout type and the plots that you specify within the layout,
you can manage up to four axes for 2-D plots:
By default,
plot data are mapped to the primary axes. To enable you to override
the default, plot statements that support a secondary X2 axis provide
an XAXIS= option that can map data to the X or X2 axis. Plot statements
that support a Y axis provide a YAXIS= option that can map data to
the Y or Y2 axis.
To determine
the axis features within a layout, the GTL must first determine what
data must be mapped to a particular axis. Thus, your use of primary
and secondary axes on plot specifications affects the GTL’s
determination of default axis features for the layout.
For example,
the plot statements in the following template specify Y-data mappings
to the Y2 and Y axes:
proc template;
  define statgraph y2axis;
    begingraph;
      layout overlay;
        histogram weight / scale=count yaxis=y2;
        histogram weight / scale=percent yaxis=y;
        densityplot weight / normal();
      endlayout;
    endgraph;
  end;
run;
proc sgrender data=sashelp.class template=y2axis;
run;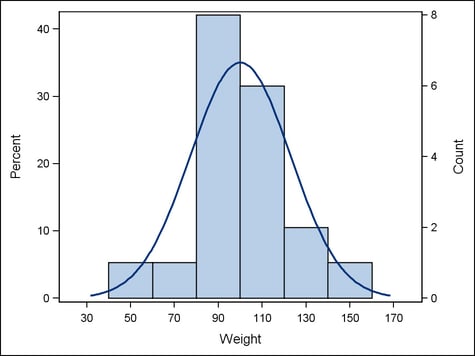
In this
example, the first HISTOGRAM maps its Y-axis data to the Y2 axis,
and the second HISTOGRAM maps its Y-axis data to the Y axis. The DENSITY
plot does not explicitly map its Y-axis data, so the default Y axis
is used. None of the plots explicitly map X-data, so the default X
axis is used for all three plots. Thus, the GTL must manage any interactions
that result from representing multiple plots on the X and Y axes.
For example, on the X axis, it must determine an appropriate data
range for representing the data values of all three plots.
When establishing
axis features for each axis, the GTL determines which plot specifications
map data to the axis. The GTL also collects the data for all of the
plots that must be represented and maps that data to the designated
axis. The next section discusses the criteria the GTL uses to determine
the axis features for the axes after this mapping has been done for
each axis.
When Plots Share Data and a Common Axis
Overview
If a layout
block contains multiple plots that share data and a common axis, the
plot settings often interact in ways that affect the axis features.
Axis features include the axis type, axis label, tick-mark layout,
and so on. The GTL resolves these interactions in ways that vary according
to the layout block and plot statements.
Note: Axis interactions
might not occur if other settings in the template prevent them. As
discussed in in Plot Data Are Mapped to a Designated Axis, if two plot statements are within
an OVERLAY layout, one of them might map its data to the X axis and
the other might map its data to the X2 (top) axis, thus avoiding the
interactions that might occur if they both mapped their data to the
X axis.
Axis Features in Overlay-type Layouts
Overlay-type
layouts (OVERLAY, OVERLAYEQUATED, and PROTOTYPE, for example) build
a composite from one or more GTL-statements.
Within
overlay-type layouts, if you do not explicitly set axis features in
your template statements, the GTL automatically determines them. It
sets the axis features based on the layout(s) and plot(s) in the layout
block and the data that are associated with the template at run time.
If only
one plot statement within an overlay-type layout generates an axis,
then determining axis features is straight forward: the features are
derived directly from the plot type and the columns that are used
for the plot data. For example, if a LAYOUT OVERLAY block contains
a single SCATTERPLOT and the X variable specifies a numeric column
of children’s weights, the default X-axis type is LINEAR. The
default X-axis label is the column label of the WEIGHT variable. If
the WEIGHT variable has no defined label, the column name is used
as a label.
When an
overlay-type layout contains multiple plots that generate axes, the
GTL can determine default axis features for the shared axes. Alternatively,
you can use the PRIMARY= option on one of the plot statements to specify
which plot you want the GTL to use. The following code fragment explicitly
specifies that the SCATTERPLOT of children’s weights be used
to determine axis features within the layout:
layout overlay;
  scatterplot x=weight ... / primary=true;
  ...
The following
SCATTERPLOT specifies a string variable on the X= argument:
layout overlay;
  scatterplot x=name ... / primary=true;
  ...
In this
case, the default X-axis type is DISCRETE and the X-axis label is
the column label of NAME, or the column name if no label exists.
If a SCATTERPLOT’s
X= argument specifies a column that has a SAS DATETIME format, the
default X-axis type is TIME and the default X-axis label is the column
label or name of the datetime column:
layout overlay;
  scatterplot x=date ... / primary=true;
  ...
For some
plot types, the default axis type does not directly correlate to the
specified column’s data type. For example, the following code
fragment specifies a BARCHART for the numeric column AGE:
layout overlay;
  barchart x=age ... / primary=true;
  ...
Because
a BARCHART requires a discrete X axis, the default X-axis type in
this case is DISCRETE, in spite of the fact that column AGE is numeric.
The X-axis label is the column label of AGE, or the column name if
no label exists.
Axis Features in Data Panel and Data Lattice Layouts
The criteria
discussed inAxis Features in Overlay-type Layouts apply to determining the default
axis features for the plots within DATAPANEL and DATALATTICE layouts.
Both of these layout types nest a LAYOUT PROTOTYPE statement within
their layout blocks. In both cases, the plot statements within the
LAYOUT PROTOTYPE block—an overlay-type layout—determine
the axis features for the plot display.
However,
one distinction is worth noting. The DATAPANEL and DATALATTICE layouts
do not support the display of secondary X2 (top) or secondary Y2 (right)
axes. Thus, you cannot use secondary axes within these layout types
to avoid competition among layout cells for determining axis features
in the plot display.
Axis Features in Lattice-type Layouts
The LAYOUT
LATTICE statement can create a grid of graphs that automatically aligns
plot areas, data display areas, labels, and headers across the columns
and rows in the layout. The layout gives you the option of unifying
the scale of the data ranges that are displayed in the graphs.
If a LAYOUT
LATTICE specification generates only one cell, then no competition
exists between cells for determining axis features in the display.
In this case, the axis features are derived directly from the plot
type and the columns used for the plot data.
Similarly,
for multi-cell displays, if either or both of the options COLUMNDATARANGE=
or ROWDATARANGE= uses the DATA setting to scale axis data ranges separately
for each cell in the layout, then the layout cells are independent.
The independent cells do not interact with each other for determining
the axis features in the display.
Axes are
shared in the layout when either or both of the options COLUMNDATARANGE=
or ROWDATARANGE= is used to unite axis data ranges for layout cells.
By default in those cases, the first cell that is drawn (by default,
the top left cell) determines the axis features in the display. The
same features are used in all of the grid’s layout cells. If
you specify external axes for the columns or rows in the layout, you
can specify desired axis features on the appropriate COLUMNAXIS or
ROWAXIS statements used in the layout. In that case, any XAXIS= or
YAXIS= options on individual plot statements are ignored.
For an
example LATTICE layout with external axes, see the Example Program inLAYOUT LATTICE Statement.
Note: LATTICE layouts
support stand-alone plots, which are single plot statements that are
specified directly in the LATTICE layout block and are not nested
within an overlay-type layout. Stand-alone plots within a LATTICE
layout cannot support a secondary axis, so the layout in those cases
ignores any XAXIS= or YAXIS= options on the plot statement.
Axis Features in Gridded Layouts
In a GRIDDED
layout the layout cells are independent of one another. Plot statements
within the layout cells do not share data and are not represented
on a common axis. Thus, no competition exists among layout cells for
determining the axis features.
Note: GRIDDED layouts
support “stand-alone plots,” which are single plot statements
that are specified directly in the GRIDDED layout block and are not nested within an overlay-type layout. Stand-alone
plots within a GRIDDED layout cannot support a secondary axis, so
the layout in those cases ignores any XAXIS= or YAXIS= options on
the plot statement.
Plot Axis Types Must Agree on Common Axes
The GTL
is extremely flexible and enables you to generate a wide variety of
plot displays. However, if you request incompatible plot displays
within the same layout, the results are unpredictable.
When Plots Share Data and a Common Axis discusses the criteria GTL uses to determine
the default axis features. After the axis type has been determined,
the GTL expects that all plots that share that axis will have the
assigned axis type. The expectation applies whether you specify axis
features in your template or let GTL determine default features.
For example,
a BOXPLOT cannot be overlaid by a LINEPARM: the two types of plot
display are incompatible within the same set of axes. Thus, if you
were to use both a BOXPLOT statement and a LINEPARM statement within
a LAYOUT OVERLAY block, only one of them can be displayed. The GTL
therefore displays the primary plot (the first specified plot by default,
or the plot designated as primary by setting PRIMARY=TRUE). The other
plot is not displayed.
Similarly,
a BARCHART requires a discrete X-axis, whereas a HISTOGRAM cannot
be displayed on a discrete axis. If you specify both a BARCHART and
a HISTOGRAM within the same overlay-type layout, only the primary
plot is displayed and the other plot is rejected from the display.
Axis types
must also be the same for plots that must share an axis across the
columns or rows in a multi-cell layout. For example, in a LAYOUT LATTICE,
the GTL expects that plots have the same axis type and data ranges
if they are to share an external axis. Otherwise, the external axis
cannot be displayed for that row or column.