Example Program and Statement Details

Example Graph

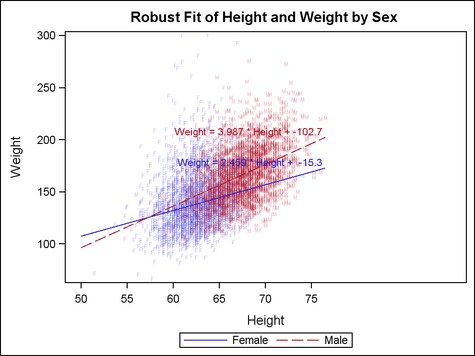
The following graph was generated by the Example Program:
Example Graph with Lines Generated with a LineParm Statement

Example Program

The LINEPARM statement draws a line based on a point and the slope of the line that passes through that point. You can use this statement to create a reference line with any slope or, in this example, to draw a fit from a linear regression. Many SAS/STAT procedures create output data sets containing a Y-intercept and slope and coefficient for the linear regression equation.
proc template;
 define statgraph lineparm;
  begingraph;
   entrytitle "Robust Fit of Height and Weight by Sex ";
   layout overlay / xaxisopts=(offsetmax=.35);
    scatterplot x=height y=weight / group=sex
     markercharacter=eval(substr(sex,1,1))
     markercharacterattrs=(size=5pt) datatransparency=.7;
    lineparm x=0 y=intercept slope=slope /
     name="Line" group=sex
     curvelabel=eval("Weight = "||put(slope,5.3)||
       " * Height + "||put(intercept,6.1))
     curvelabellocation=inside
     curvelabelattrs=(size=8pt);
    discretelegend "Line";
   endlayout;
  endgraph;
 end;
run;

proc sort data=sashelp.heart(keep=height weight sex)
     out=heart;
  by sex;
run;

ods exclude all;
proc robustreg data=heart method=m
     outest=stats(rename=(height=slope));
  by sex;
  model weight=height;
run;

data all;
  merge heart stats(keep=intercept slope sex);
run;

ods select all;
proc sgrender data=all template=lineparm;
run;

Statement Summary

The LINEPARM statement creates a straight line. You can generate a single line by specifying a constant for each required argument. You can generate multiple lines by specifying a numeric column for any or all required arguments. If any of the X= or Y= columns contains a missing value, no line is drawn. To request a vertical line, specify SLOPE= . (specify a missing value as a constant or column value).
A LINEPARM statement can be used in any layout except GRIDDED or OVERLAY3D layouts. The parent layout must include another plot statement that is derived from data values that establish a data range for the axes. For example, it can be used with a scatter plot or a histogram.
To draw vertical or horizontal reference lines, consider using the simpler REFERENCELINE statement.

Required Arguments

X=number | numeric-column | expression
specifies the X coordinate of a point.
By default, if the specified value is outside of the data range, then the data range is extended to include the specified intercept. This behavior can be changed with the CLIP= option. If a numeric-column is specified and the column contains missing values, no line is drawn for the missing values.
Values are displayed in the units of the data.
Y=number | numeric-column | expression
specifies the Y coordinate of a point.
By default, if the specified value is outside of the data range, then the data range is extended to include the specified intercept. This behavior can be changed with the CLIP= option. If a numeric-column is specified and the column contains missing values, no line is drawn for the missing values.
Values are displayed in the units of the data.
SLOPE=number | numeric-column | expression
specifies the slope of the line.
Slope can be positive or negative.
SLOPE= 0 creates a line parallel to the X-axis. SLOPE= . (a missing value) creates a line parallel to the Y-axis.

Options

Statement Option
Description
Specifies whether the data for the line are considered when determining the data ranges for the axes.
Specifies the label of the line.
Specifies the color and font attributes of the line label.
Specifies the location of the line label relative to the plot area.
Specifies the position of the line label relative to the line end points.
Specifies the degree of the transparency of the lines.
Specifies whether the line is to be drawn to the area bounded by the axes, ignoring any specified offsets.
Creates a separate parameterized line plot for each unique group value of the specified column.
Specifies indices for mapping line attributes (color and pattern) to one of the GraphData1 - GranphDataN style elements.
Specifies a label for use in a legend.
Specifies the properties of the line.
Assigns a name to a plot statement for reference in other template statements.
Specifies whether data are mapped to the primary X (bottom) axis or the secondary X2 (top) axis.
Specifies whether data are mapped to the primary Y (left) axis or the secondary Y2 (right) axis.
CLIP= boolean
specifies whether the data for the line are considered when determining the data ranges for the axes.
Default: FALSE
FALSE
The data for the line contributes to data range for each axis. Each axis might be extended to force the display of the line.
TRUE
The data for the line are ignored when establishing axis scales. Each axis scale is determined by the other plots in the layout. This might result in the line not being displayed if its data range is not within the data ranges of the other plots.
CURVELABEL= "string" | column | expression
specifies a label for the line.
Default: no default
Interaction:
  • For a single line, use "string".
  • For multiple lines, use a column to define the labels for each unique value.
The font and color attributes for the label are specified by the CURVELABELATTRS= option.
CURVELABELATTRS=style-element | style-element (text-options) | (text-options)
specifies the color and font attributes of the line label. See General Syntax for Attribute Options for the syntax on using a style-element and Text Options for available text-options.
Default:
  • For non-grouped data, the GraphValueText style element.
  • For grouped data, text color is derived from the GraphData1:ContrastColor - GraphDataN:ContrastColor style references. The font is derived from the GraphValueText style element.
Interaction: For this option to take effect, the CURVELABEL= option must also be used.
Interaction: This option’s COLOR= setting overrides the colors indicated by the GROUP= option.
When the GROUP= option is used, each distinct group value might be represented by a different color. The line label that is associated with the group is assigned the group color. This option can be used to specify a single color for all line labels in a graph, without affecting the line colors.
CURVELABELLOCATION=INSIDE | OUTSIDE
specifies the location of the line label relative to the plot area.
Default: INSIDE
INSIDE
inside the plot area
OUTSIDE
outside the plot area
Restriction: OUTSIDE cannot be used when the LINEPARM is used in multi-cell layouts such as LATTICE, DATAPANEL, or DATALATTICE, where axes might be external to the grid.
Interaction: For this option to take effect, the CURVELABEL= option must also be specified.
Interaction: This option is used in conjunction with the CURVELABELPOSITION= option to determine where the line labels appear. For more information, see Location and Position of Curve Labels.
CURVELABELPOSITION=AUTO | MAX | MIN
specifies the position of the line label relative to the line end points.
Default: AUTO when CUVELABELLOCATION=OUTSIDE MAX when CURVELABELLOCATION=INSIDE
AUTO
Only used when CURVELABELLOCATION=OUTSIDE. The line label is positioned automatically near the line boundary along unused axes whenever possible (typically Y2 and X2) to avoid collision with tick values.
MAX
Forces the line label to appear near maximum line values (typically, upper right).
MIN
Forces the line label to appear near minimum line values (typically, lower left).
Restriction: The AUTO setting is not supported if CURVELABELLOCATION=INSIDE is specified.
Interaction: For this option to take effect, the CURVELABEL= option must also be specified.
Interaction: This option is used in conjunction with the CURVELABELLOCATION= option to determine where the line label appears. For more information, see Location and Position of Curve Labels.
DATATRANSPARENCY=number
specifies the degree of the transparency of the line.
Default: 0
Range: 0 (opaque) to 1 (entirely transparent)
EXTEND=boolean
specifies whether the line is to be drawn to the area bounded by the axes.
Default: FALSE
If this option is not specified, then there can be a small gap between the line and the axis. The gap is controlled by the axis offset. If the offset is set to 0, then there is no gap.
GROUP=column | expression
creates a separate parameterized line plot for each unique group value of the specified column.
Default: Each distinct group value might be represented in the graph by a different combination of line color and line pattern. Line colors vary according to the GraphData1:ContrastColor - GraphDataN:ContrastColor style references, and line patterns vary according to the GraphData1:LineStyle - GraphDataN:LineStyle style references.
Restriction: When this option is used, the X, Y, and SLOPE arguments must specify numeric columns.
Interaction: The group values are mapped in the order of the data, unless the INDEX= option is used to alter the default sequence of line colors and line patterns.
The LINEATTRS= option can be used to override the representations that are used to identify the groups. For example, LINEATTRS=(PATTERN=SOLID) can be used to assign the same pattern to all of the lines, letting the line color distinguish group values. Likewise, LINEATTRS=(COLOR=BLACK) can be used to assign the same color to all of the lines, letting the line pattern distinguish group values.
INDEX=positive-integer-column | expression
specifies indices for mapping line attributes (color and pattern) to one of the GraphData1 - GranphDataN style elements.
Default: no default
Interaction: For this option to take effect, the GROUP= option must also be specified.
Interaction: All of the indexes for a specific group value must be the same. Otherwise, the results are unpredictable.
Interaction: If this option is not used, then the group values are mapped in the order of the data.
Interaction: The index values are 1-based indices. For the style elements in GraphData1 - GraphDataN, if the index value is greater than N, then a modulo operation remaps that index value to a number less than N to determine which style element to use.
Discussion: Indexing can be used to collapse the number of groups that are represented in a graph. For more information, see Remapping Groups for Grouped Data.
LEGENDLABEL= "string"
specifies a label for use in a legend.
Default: The string specified on the NAME= option.
Interaction: If the GROUP= option is specified, this option is ignored.
LINEATTRS=style-element | style-element (line-options) | (line-options)
specifies the attributes of the line. See General Syntax for Attribute Options for the syntax on using a style-element and Line Options for available line-options.
Default:
  • For non-grouped data, the GraphDataDefault style element.
  • For grouped data, the ContrastColor, LineStyle, and LineThickness attributes of the GraphData1- GraphDataN style elements.
NAME="string"
assigns a name to a plot statement for reference in other template statements.
Default: no default
Restriction: The string is case sensitive, cannot contain spaces, and must define a unique name within the template.
Interaction: The string is used as the default legend label if the LEGENDLABEL= option is not used.
The specified name is used primarily in legend statements to coordinate the use of colors and line patterns between the graph and the legend.
XAXIS=X | X2
specifies whether data are mapped to the primary X (bottom) axis or to the secondary X2 (top) axis.
Default: X
Restriction: Another plot that establishes a data range for the axis must be included.
Interaction: The overall plot specification and the layout type determine the axis display. For more information, see How Axis Features are Determined.
YAXIS=Y | Y2
specifies whether data are mapped to the primary Y (left) axis or to the secondary Y2 (right) axis.
Default: Y
Restriction: Another plot that establishes a data range for the axis must be included.
Interaction: The overall plot specification and the layout type determine the axis display. For more information, see How Axis Features are Determined.