Example Program and Statement Details
Example Program
This
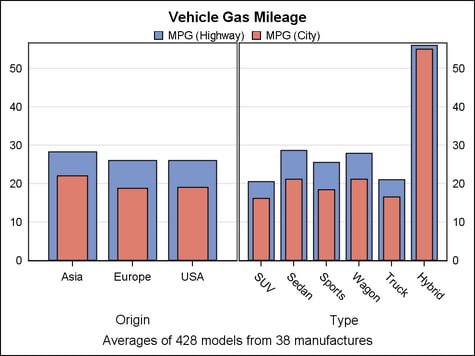
example shows a two-cell lattice layout (two columns, one row). The
ROWAXES block makes the primary and secondary Y axes external to both
cells. The secondary Y axis is displayed on the right.
proc template;
 define statgraph layoutlattice;
  begingraph;
  entrytitle "Vehicle Gas Mileage";
  entryfootnote "Averages of 428 models from 38 manufactures";
    layout lattice / columns=2 rowdatarange=union;
     layout overlay / cycleattrs=true;
       barchart x=origin y=mpg_highway /
        stat=mean barwidth=.8 name="H" ;
       barchart x=origin y=mpg_city /
        stat=mean barwidth=.5 name="C" ;
     endlayout;
     layout overlay / cycleattrs=true;
       barchart x=type y=mpg_highway /
        stat=mean barwidth=.8;
       barchart x=type y=mpg_city /
        stat=mean barwidth=.5;
     endlayout;
     sidebar / align=top;
       discretelegend "H" "C" / border=false;
     endsidebar;
     rowaxes;
       rowaxis / display=(tickvalues)
        displaysecondary=(tickvalues) griddisplay=on;
     endrowaxes;
    endlayout;
  endgraph;
 end;
run;
proc sgrender data=sashelp.cars template=layoutlattice;
run;
Statement Summary
The LAYOUT
LATTICE statement creates a grid of graphs that are aligned across
columns and rows. For plot statements that are specified in the layout
block or nested in a LAYOUT OVERLAY statement, the LATTICE layout
automatically aligns the plot areas and tick display areas in the
plots.
Note: To achieve
the alignment, the LATTICE layout automatically aligns plot areas
and tick display areas across columns and rows. Also, it overrides
axis-offset settings on the OVERLAY layouts that you specify in those
columns and rows. (For details about offsets and the tick display
area, see Adjusting Axis Offsets.) If you do not want this alignment, you might use LAYOUT
GRIDDED instead. For example, if you have a heterogeneous panel of
graphs, such as a mix of scatter plots, box plots, bar charts, or
other types of graphs, you might consider using LAYOUT GRIDDED rather
than LAYOUT LATTICE.
The layout
can unify the scale of the data ranges that are displayed in the plots,
based on the values set for the COLUMNDATARANGE and ROWDATARANGE= options. The data ranges can be scaled
separately for each column, for each row, or for both. Or they can
be scaled across all columns, all rows, or all of both.
When the
data-range scales are unified, you can simplify the layout by displaying
only the external axes that apply to all of the graphs across the
corresponding columns or rows. See Axis Statements for more details.
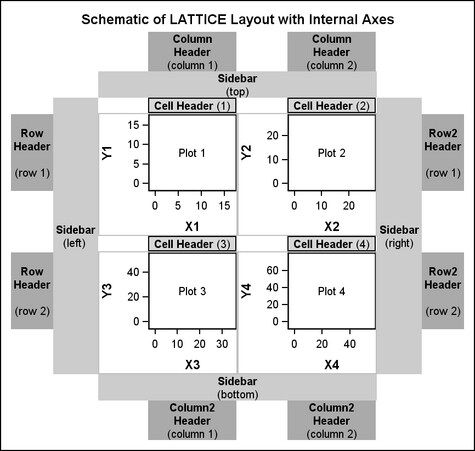
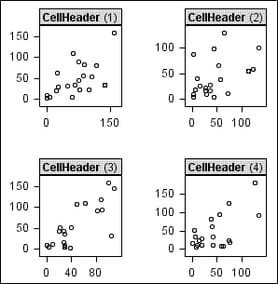
The following
figure shows the parts of the Lattice layout with the default axis
display (internal axes are displayed).
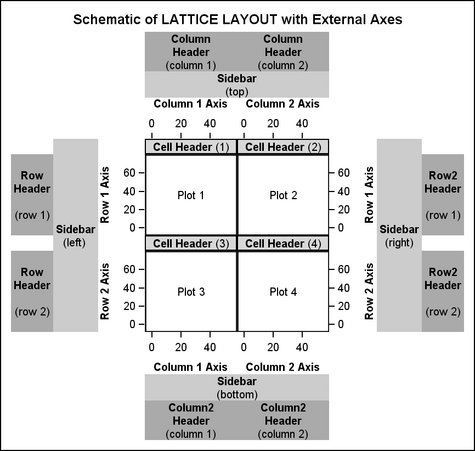
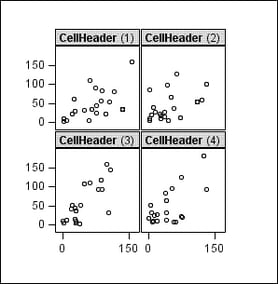
This next
figure shows the parts of the Lattice layout when the graph display
is simplified so that only external axes are displayed.
The columns
and rows can be separated by areas called “gutters,”
which are controlled by the COLUMNGUTTER= and ROWGUTTER= options. In addition, the COLUMNWEIGHTS= and ROWWEIGHTS= options can be used to allocate a
proportion of available space to each row and column.
By default,
the results of the GTL-statements are placed into the grid sequentially from left to right, wrapping
to a new row each time the current row is filled. You can use the ORDER= option to fill cells from top to bottom down
a column. In that case, the layout cells wrap to a new column each
time the current column is filled.
Cell Contents
The content
of each cell in a LAYOUT LATTICE is specified by GTL-statement(s) that can be specified independently
or enclosed in a CELL block. When you enclose the statements in a
CELL block, you can specify one or more header lines at the top of
the cell. If you do not need a cell header in a cell, there is no
need to use the CELL block.
-
Within a CELL block, a CELLHEADER block can be used to generate one or more header lines within the cell. Each header line is specified on a separate GTL-statement within the CELLHEADER block. The header block is typically used to specify one or more text statements, but other statements are allowed within the block. For example, you could specify a LAYOUT GRIDDED statement to produce a grid of text for the header
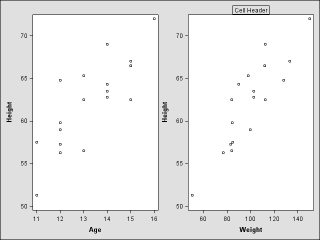
The following
example shows a LAYOUT LATTICE block that uses one GTL-statement and one cell-statement-block to generate the two-column layout shown in the following figure:
begingraph;
  layout lattice /
    columngutter=5 columns=2;

 /* independent plot statement - defines first cell */
    scatterplot x=age y=height;

 /* cell block - defines second cell */
    cell;
      cellheader;
        entry "Cell Header" / border =true;
      endcellheader;

      scatterplot x=weight y=height;

    endcell;
  endlayout;
endgraph;
Axis Statements
The axis
statements can be used to simplify and clarify the layout by displaying
only the external axes in the resulting graph.
Axis statements
are useful only if the data ranges across the affected columns or
rows are comparable and can be unified to a common scale. For example,
external axes are not supported if an affected lattice cell contains
a LAYOUT OVERLAYEQUATED statement.
To unify column data ranges,
use the COLUMNDATARANGE option. To unify row data ranges,
use the ROWDATARANGE= option. If the axis ranges are not
unified for the affected columns or rows, the axis statements in the
layout are ignored.
For columns,
external X axes (top, bottom, or both) are specified within a COLUMNAXES
block, nesting one or more COLUMAXIS statements within the block.
If a lattice cell contains a LAYOUT OVERLAY with the XAXISOPTS= option
specified, the XAXISOPTS= option is ignored. In such cases, the desired
axis features should be specified in the COLUMNAXIS statement. An
X2AXISOPTS= option is also ignored if specified on the OVERLAY.
For rows,
external Y axes (left, right, or both) are specified within a ROWAXES
block, nesting one or more ROWAXIS statements within the block. If
a lattice cell contains a LAYOUT OVERLAY with the YAXISOPTS= option
specified, the YAXISOPTS= option is ignored. In such cases, the desired
axis features should be specified in the ROWAXIS statement. A Y2AXISOPTS=
option is also ignored if specified on the OVERLAY.
The following
example shows a LAYOUT LATTICE block that uses a ROWAXES block to
set external axes and display gridlines for the row display.
 begingraph;
   layout lattice /
      rowdatarange=union
      columns=2;

      /* axis definitions */
      rowaxes;
         rowaxis /griddisplay=on;
      endrowaxes;

      /* cell contents */
      scatterplot x=x y=t;
      scatterplot x=x y=y;

   endlayout;
 endgraph;
Here,
the LAYOUT LATTICE statement specifies the ROWDATARANGE option to
unify the data ranges across rows in the layout. Because LAYOUT LATTICE
specifies COLUMNS=2 and there are two plot statements in the template,
the resulting graph has two columns and only one row. Thus, only one
ROWAXIS statement is needed in the ROWAXES block to specify axis attributes
for that row of graphs.
Header Statements
Header
statements are used to display one or more headers for the columns
and rows in a Lattice layout. Each statement is specified as a block
in the form statement - ENDstatement. The header block is typically used to specify one or more text
statements, but other statements are allowed within the block. For
example, you could specify a LAYOUT GRIDDED statement to produce a
grid of text for the header.
Sidebar Statements
A LAYOUT
LATTICE supports the display of a sidebar between a row or column header and an external axis. (See the figures
in .)Example Program and Statement Details A sidebar spans
across columns or rows and is useful for displaying information that
applies to all of the columns or all of the rows. For example, sidebars
are useful for displaying legends.
Options
specifies whether this
layout is automatically aligned within its parent when nested within
an overlay-type layout. For more information about how child positions
are determined in an overlay-type layout, see the LAYOUT OVERLAY’s Example Program and Statement Details.
Within the parent layout,
restrict this layout’s possible locations to those locations
in the specified location-list, and use the location-list position that least collides with the parent layout’s other
graphics features. The location-list is blank-separated and can contain any of these locations: TOPLEFT,
TOP, TOPRIGHT, LEFT, CENTER, RIGHT, BOTTOMLEFT, BOTTOM, and BOTTOMRIGHT.
specifies the attributes
of the border line around the layout. See General Syntax for Attribute Options for the syntax
on using a style-element and Line Options for available line-options.
specifies how the X-axis
data ranges of graphs within the layout columns are scaled.
scales the X-axis data
ranges separately for each column in the layout. This setting is supported
only if all plots across the column can share the same data range
and axis type. For more information, see Plot Axis Types Must Agree on Common Axes.
scales the X-axis data
ranges across all columns in the layout. This setting is supported
only if all plots across the column can share the same data range
and axis type. For more information, see Plot Axis Types Must Agree on Common Axes.
Restriction: If any plot statement in any cell contains an XAXIS=X2 option, this
option is ignored if it is set to UNION or UNIONALL. The union setting
causes all data to be mapped to the X axis.
specifies the number
of columns in the layout.
Default: If ORDER=ROWMAJOR, the default is 1. If ORDER=COLUMNMAJOR,
as many columns are created as are needed to satisfy the ROWS= request.
Interaction: If both ROWS=n and COLUMNS=m is specified, an n by m grid of cells is created.
If the number of statements that define cell contents is greater than n x m,
the grid size does not expand and some statements are not displayed.
If the number of statements that define cell contents is less than n x m,
the grid will contain empty cells.
specifies the fractional
proportion of each cell relative to the overall grid width, not including
headers, sidebars, and column axes.
specifies this layout’s
horizontal alignment within its parent when nested within an overlay-type
layout. For more information about how child positions are determined
in an overlay-type layout, see the LAYOUT OVERLAY’s Example Program and Statement Details.
Restriction: This option is available only when this statement is nested within
an overlay-type layout. It is ignored if this statement is the outermost
layout or if the parent layout is not an overlay-type layout.
specifies the amount
of extra space that is added inside the layout border.
Default: The default padding for all sides is 0. Values without units are
in pixels (px). A unit must be provided if other than pixels.
Enables separate settings
for the left, right, top, and bottom padding dimensions. Use the pad-options to create non-uniform padding. These
options must be enclosed in parentheses. Each option is specified
as a name = value pair. Sides
not assigned padding are padded with the default amount.
| LEFT=dimension | specifies the amount of extra space added to the left side. |
| RIGHT=dimension | specifies the amount of extra space added to the right side. |
| TOP=dimension | specifies the amount of extra space added to the top. |
| BOTTOM=dimension | specifies the amount of extra space added to the bottom. |
specifies how the Y-axis
data ranges of graphs within the layout rows are scaled.
scales the Y-axis data
ranges separately for each row in the layout. This setting is supported
only if all plots down the row can share the same data range and axis
type. For more information, see Plot Axis Types Must Agree on Common Axes.
scales the Y-axis data
ranges across all rows in the layout. This setting is supported only
if all plots down the row can share the same data range and axis type.
For more information, see Plot Axis Types Must Agree on Common Axes.
Restriction: If any plot statement in any cell contains a YAXIS=Y2 option, this
option is ignored whenever it is set to UNION or UNIONALL. The union
setting causes all data to be mapped to the Y axis.
specifies the number
of rows in the layout.
Default: If ORDER=COLUMNMAJOR, the default is 1. If ORDER=ROWMAJOR, as many
ROWS are created as needed to satisfy the COLUMNS= request.
Interaction: If both ROWS=n and COLUMNS=m is specified, an n by m grid of cells is created.
If the number of statements that define cell contents is greater than n x m,
the grid size does not expand and some statements are not displayed.
If the number of statements that define cell contents is less than n x m,
the grid will contain empty cells.
specifies this layout’s
vertical alignment within its parent when nested within an overlay-type
layout. For more information about how child positions are determined
in an overlay-type layout, see the LAYOUT OVERLAY’s Example Program and Statement Details.