Viewing and Saving the Results of Your Changes
Results of Your Changes to the Graph
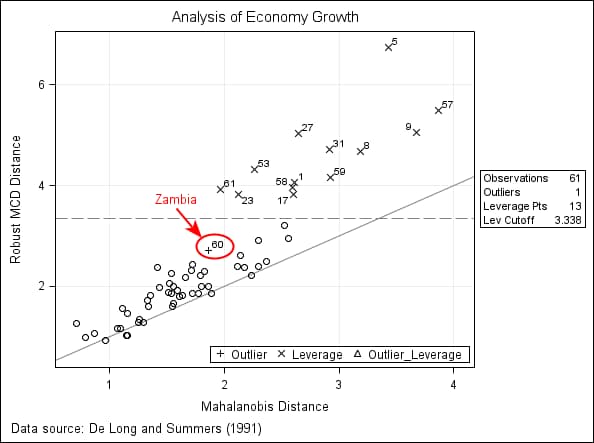
Because you have applied
the Journal style, all of the objects in the graph are in shades of
gray. However, the annotations (oval and arrow) are red because you
explicitly set their color. If you want the annotation color to be
consistent with the style’s colors, you can restore the annotations
to their default color.
For a description of
the graph, see About the Economy Growth Example.
Save Your Changes
-
Specify the directory, filename, and file type. For more information, see Save Graph Output .