About the Economy Growth Example
The Economy Growth example
uses the Distance by Distance graph, which is generated using the
ROBUSTREG procedure. The main purpose of robust regression is to detect
outliers and leverage points and to provide stable results in the
presence of such influential points.
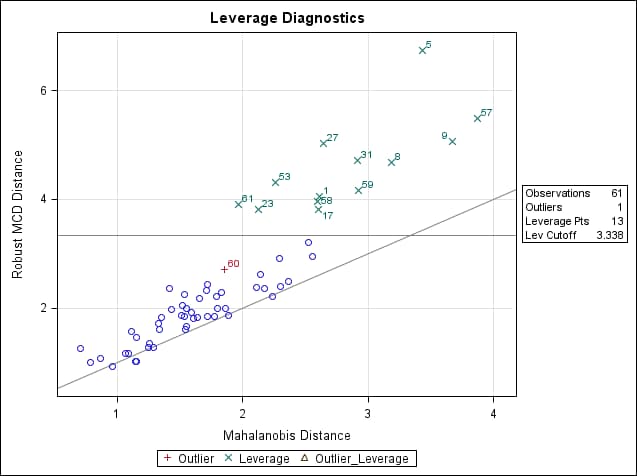
This graph identifies
leverage points for economic growth data for different countries.
The distances displayed are appropriately scaled. They measure the
distance from the center of the data to the observation. The vertical
axis distance is a robust version of the classical distance measure
on the horizontal axis. Observations with large discrepancies between
these two distances have high leverage. The diagonal reference line
helps to identify these observations. Such observations also have
large ROBUST MCD distance; those observations that are above the horizontal
leverage cutoff line are considered leverage points.
The data used in this
example was obtained from a national growth study conducted by De
Long and Summers in 1991. (footnote1)
FOOTNOTE 1:
“Equipment Investment
and Economic Growth.” 1991. Quarterly Journal of Economics 106: 445–501.
[return]