Select a Plot
You can select a plot
by clicking or right-clicking the plot. You right-click a plot to
display a pop-up menu and perform operations on the selected plot,
such as assigning data or changing the plot properties.
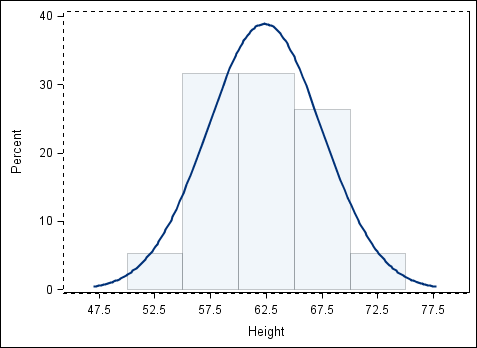
When you click or right-click
a plot, the plot remains in full color. Any other plots in the cell
appear dimmed. The following image shows a normal density curve that
is selected. The histogram is dimmed.
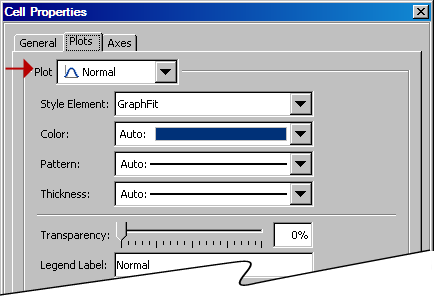
If you right-click a
plot and select Plot Properties from the
pop-up menu, the Cell Properties dialog box
appears and displays the selected plot in the Plot list box. The following display shows the Cell Properties dialog box with the normal density plot selected.