Adding Reference Lines to Graphs
About Adding Reference Lines
When you add a reference
line to a graph, the line is placed in a location near the cursor.
A dialog box appears in which you can specify the position value and
other settings. After you add the reference line, you can reposition
line.
ODS Graphics Designer provides the following types of
lines. Each type is identified by a unique icon in the user interface:


Add a Reference Line to a Graph
The graph cell in which
you add a reference line must already contain at least one plot. The
line is overlaid on the plot.
-
Add a reference line the same way you would add any other plot. For instructions, see Add a Plot to a Graph.
-
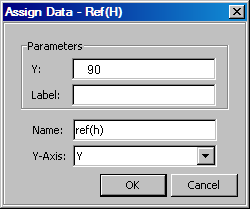
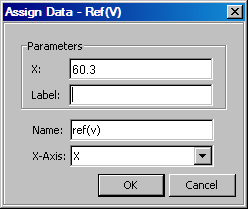
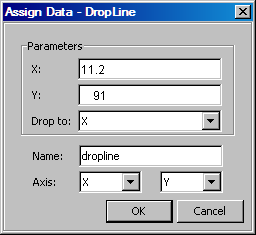
Specify the data parameters for the line. The parameters vary with the type of line that you are adding. Here are the parameters that are specific to each type of line:Note: The default X and Y settings depend on where the mouse button is released when you add the line.
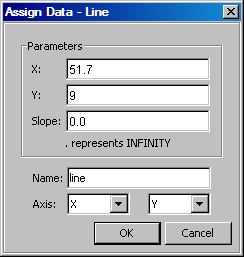 In the Slope text box, specify a slope for the line. A slope value of zero creates a horizontal line that is parallel to the X axis. A slope value of infinity creates a vertical line that is parallel to the Y axis. To create a vertical line, specify a decimal point (.) as the slope.
Reposition a Reference Line
After you add a line,
you can move the line to a different location. When you position the
cursor over the line, the cursor changes to a two-headed arrow  . You can then click and drag the line to the new
location.
. You can then click and drag the line to the new
location.
Note: You cannot move a sloped
line by using the click-and-drag method. You must use the Assign Data dialog box.
-
Specify the parameters for the position that you want. For a description of these parameters, see Add a Reference Line to a Graph.
Change the Length of a Drop Line
When you position the
cursor at the tip of a drop line, the cursor changes to a double arrow  . You can then click and drag to lengthen or shorten
the line.
. You can then click and drag to lengthen or shorten
the line.
. You can then click and drag to lengthen or shorten
the line.
-
Change the X parameter to modify a horizontal drop line, and the Y parameter to modify a vertical drop line. For a description of these parameters, see Add a Reference Line to a Graph.