Plot-Specific Properties

About Plot-Specific Properties

The following sections summarize the properties that are specific to each type of plot.
You change plot properties on the Plots tab of the Cell Properties dialog box. For instructions on changing plot properties, see Change Plot Properties.

Scatter Properties

Scatter Plot Properties
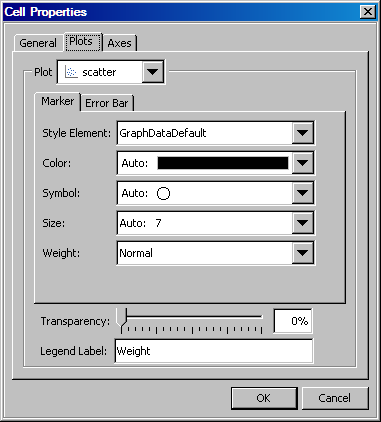
Scatter Properties
Marker tab
You can change the marker properties for the scatter plot. See Marker Properties.
Tip
To hide markers in a scatter plot, select 0 for the size.
Error Bar tab
The Error Bar tab is available only if you specify error upper and lower limits in the Assign Data dialog box. Here you can specify line properties. See Line Properties.
Data Label tab
You can select a position for the data label with respect to the marker. The default value of Auto automatically determines the best label position for each marker. The Data Label tab is available only if you specify a data label role in the Assign Data dialog box.

Series, Needle, and Step Properties

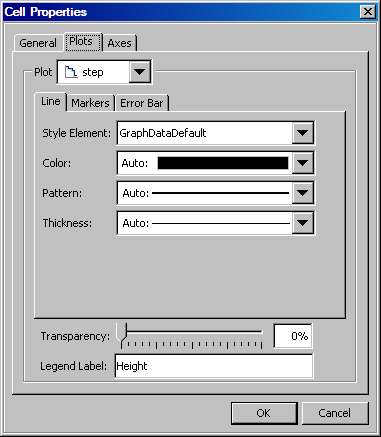
The properties for series, needle, and step plots are similar. The following display shows the properties for a step plot.
Step Plot Properties
Step Properties
Line tab
On this tab, you can specify line properties for the step plot. See Line Properties.
Markers tab
Select the Markers check box to display markers and specify marker properties. See Marker Properties.
(Step plot only) Error Bar tab
The Error Bar tab is available only if you specify error upper and lower limits in the Assign Data dialog box. Here you can specify line properties.

Histogram Properties

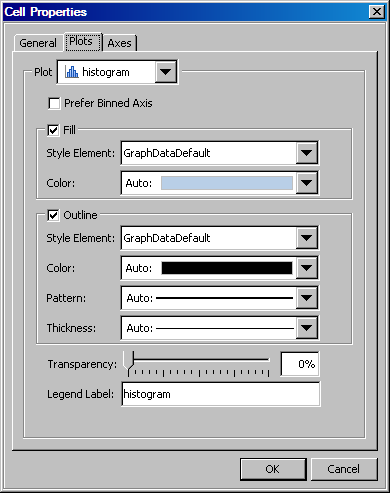
These properties apply to vertical and horizontal histograms.
Histogram Properties
Select Prefer Binned Axis to specify that the category axis tick marks coincide with the midpoint of each bin.
You can change the fill and outline properties. See Fill and Outline Properties.

Box Properties

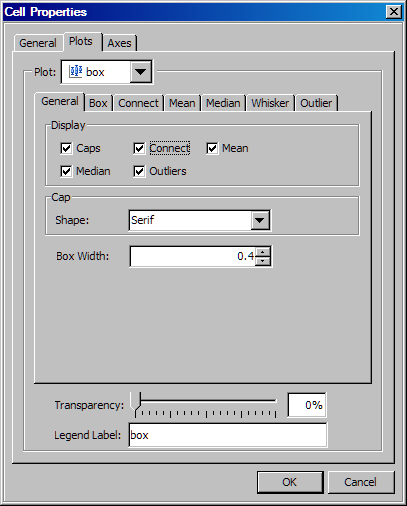
These properties apply to vertical and horizontal box plots.
Box Plot Properties
Box Properties
General tab
Select the check box for each item that you want displayed. An item must be selected in order to change its properties.
All items except connect lines are selected by default. A connect line joins a statistic from box to box.
From the Shape list box, you can select a different shape for the caps that appear at the ends of the whiskers.
Box Width enables you to specify the width of the boxes as a ratio of the maximum possible width. Specify a value from 0.0 (narrowest) to 1.0 (widest).
Tip
You can also select a box edge and drag it to the desired width.
Box tab
Here you can specify outline and fill properties. See Fill and Outline Properties.
The Outline check box is selected but dimmed. You can clear the Fill check box, but you cannot clear the Outline check box.
Connect, Median, and Whisker tabs
In these tabs, you can specify line properties for the connect, median, and whisker lines. See Line Properties.
Mean and Outlier tabs
You can change the marker properties for the mean and outlier markers. See Marker Properties.

Bar and Bar Error Properties

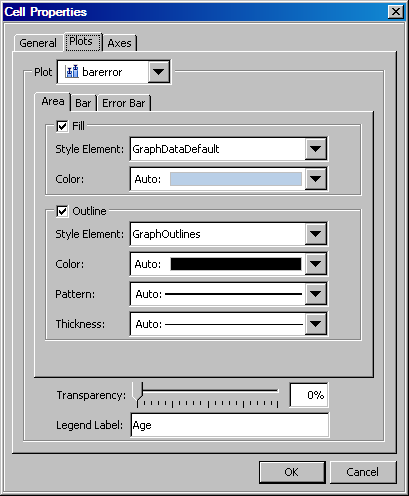
These properties apply to vertical and horizontal bar and bar error charts.
Bar Error Plot Properties
Bar Error Properties
Area tab
You can change the fill and outline properties. See Fill and Outline Properties.
Bar tab
You can select the bar skin and the bar width from the list boxes. The skin changes the appearance of the bars. Here are the options:
NONE
Dataskin NONE
CRISP
Dataskin CRISP
GLOSS
Dataskin GLOSS
MATTE
Dataskin MATTE
PRESSED
Dataskin PRESSED
SHEEN
Dataskin SHEEN
Bar Width enables you to specify the width of the bars as a ratio of the maximum possible width. The maximum width is equal to the distance between the center of each bar and the centers of the adjacent bars. Specify a value from 0.0 (narrowest) to 1.0 (widest).
Tip
You can also select a bar edge and drag it to the desired width.
(Bar charts only) To display a label at the top of the vertical bars or to the right of the horizontal bars, select the Bar Label check box.
Error Bar tab
(Bar error charts only.) The Error Bar tab is available only if you specify error upper and lower limits in the Assign Data dialog box. Here you can specify line properties. See Line Properties.

Band Properties

Band Plot Properties
Band Properties
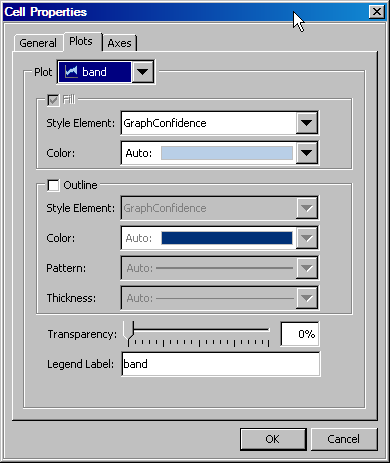
You can change the fill and outline properties. See Fill and Outline Properties.
By default there is no outline, and the Fill check box is selected but dimmed. If you select the Outline check box, then the Fill check box can be cleared. You can change the fill properties even if the check box is dimmed.

Vector Properties

Vector Plot Properties
Vector Properties
Arrow tab
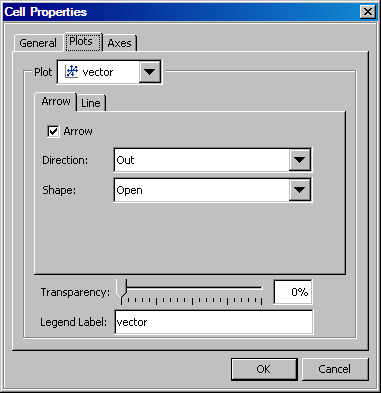
Select or clear the Arrow check box to toggle arrows on and off.
You can select the arrow direction and shape from the list boxes. Arrows can point outward from the origin, inward toward the origin, or in both directions.
Line tab
Here you can specify line properties for the vectors. See Line Properties.

Contour Properties

Contour Plot Properties
Contour Properties
General tab
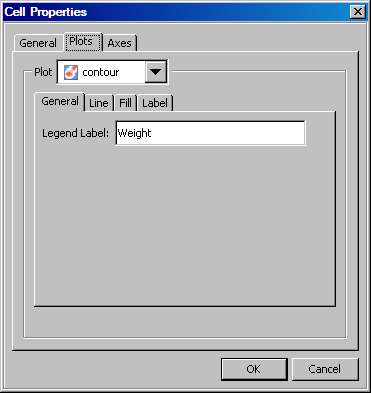
You can specify the legend label.
Line tab
If the Line tab is available, you can specify line properties. See Line Properties.
The Line tab is available for the following types of contour plots:
  • Line
  • LineGradient
  • LabeledLine
  • LabeledLineFill
  • LabeledLineGradient
Fill tab
If the Fill tab is available, you can select a different style element from the list box.
To reverse the color gradient of the fill, select the Reverse color model check box.
The Fill tab is available for the following types of contour plots:
  • Fill
  • Gradient
  • LineFill
  • LineGradient
  • LabeledLineFill
  • Labeled LineGradient
Label tab
If the Label tab is available, then you can specify text properties for the contour labels. See Text Properties.
The Label tab is available for the following types of contour plots:
  • LabeledLine
  • LabeledLineFill
  • LabeledLineGradient

Fringe Properties

Fringe Plot Properties
Fringe Properties
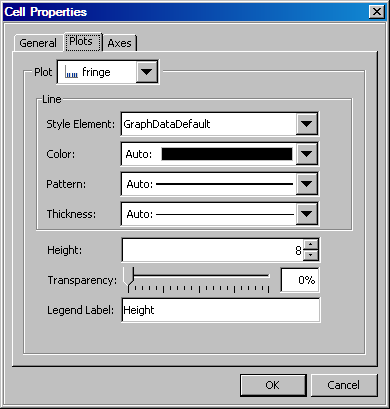
You can specify line properties for the plot. See Line Properties.
Use the Height control to adjust the height of the fringe lines. You can also enter a height.

Normal and Kernel Properties

These properties apply to vertical and horizontal normal and kernel plots.
Normal Plot Properties
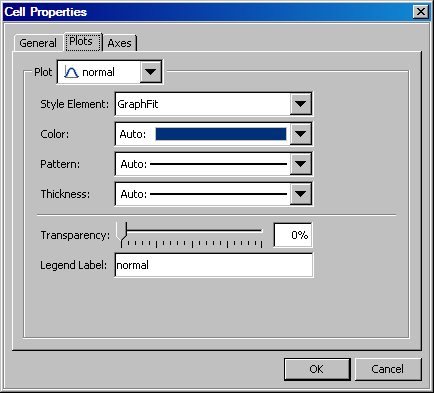
Normal Properties
You can specify line properties for the plot. See Line Properties.

Loess, Regression, PBSpline, and Model Band Properties

Loess Plot Properties
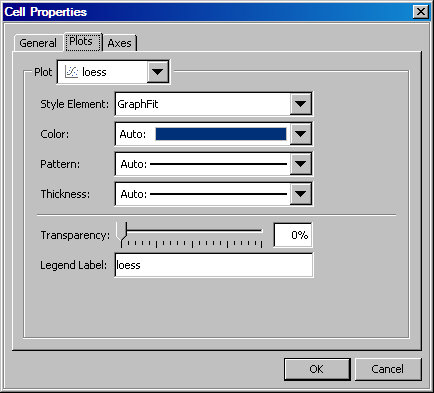
Loess Properties
You can specify line properties for the plot. See Line Properties.
If you specified model band confidence limits, then select the model band plot from the Plot list box to specify its fill and outline properties. See Fill and Outline Properties.

Ellipse Properties

Ellipse Properties
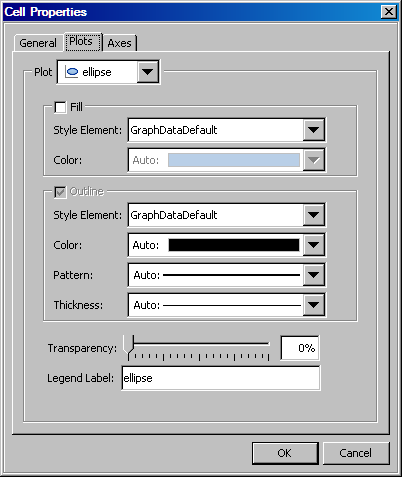
Ellipse Properties
You can change the fill and outline properties. See Fill and Outline Properties.
By default there is no fill, and the Outline check box is selected but dimmed. If you select the Fill check box, then the Outline check box can be cleared. You can change the outline properties even if the check box is dimmed.

Line Properties

These properties apply to point-and-slope lines, drop lines, and vertical and horizontal reference lines.
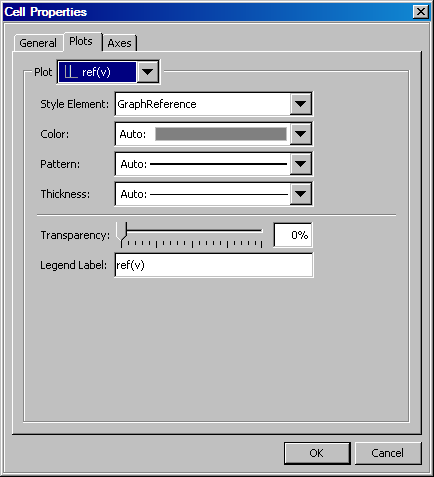
Reference Line Properties
You can specify line properties for the line. See Line Properties.

Block and Stack Block Properties

Block Plot Properties
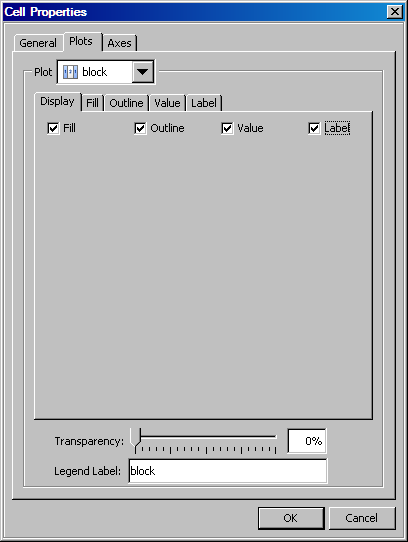
Block Properties
Display tab
Select the check box for each item that you want displayed. An item must be selected in order to change the properties of the item.
By default, the Fill and Outline check boxes are selected. You can select the following:
  • Value check box to display a value on the fill blocks
  • Label check box to display an external label for the plot
Fill tab
Select the Multicolor radio button to specify multi-color fills.
Select Alternate to specify the appearance of alternate block fills. When you select Alternate, you can change the style element and color of the fill and the alternate fill. See Fill and Outline Properties.
Outline tab
You can change the outline properties of the blocks. See Fill and Outline Properties.
Value tab
You can change the text properties of the values that appear on the blocks. See Text Properties.
You can also select the following alignment properties of the text:
Horizontal The options are left-aligned, right-aligned, center, and start. The start value centers the text at the starting value of the block.
Vertical The options are top, center, and bottom.
Label tab
You can change the text properties of the external label. See Text Properties.
You can also select the position with respect to the plot: options are left, right, top, and bottom.