General Properties
About General Plot Properties
In the Plots tab of the Cell Properties dialog box,
you can change properties that affect the appearance of the plots
in a graph.
The types of properties
that you see vary with the type of plot that you are modifying. In
general, you can specify colors, marker symbols, line attributes,
and outlines and fills. These general plot properties are described
in the following sections.
For instructions on
changing plot properties, see Change Plot Properties.
Line Properties
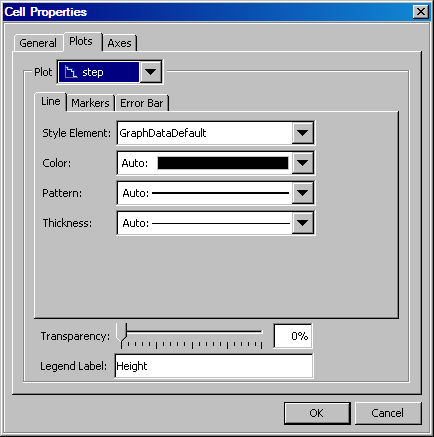
Line properties apply
to many of the plots, including series, needle, step, reference lines,
box, contour, and density plots.
The default style element
varies by plot. You can select a different style element from the
list box. For
more information about style elements, see Specifying Style Elements for Plot Properties.
You can specify the
following line attributes:
-
line color. For more information about selecting colors, see Using the Color List Box.
The attributes that
you specify here override the attributes that are derived from the
applied style element.
Fill and Outline Properties
The style element varies
by plot. For
more information about style elements, see Specifying Style Elements for Plot Properties. If you explicitly specify the color, pattern or thickness,
the attributes that you specify override the attributes that are derived
from the applied style element.
For information about
using the Color list box, see Using the Color List Box.
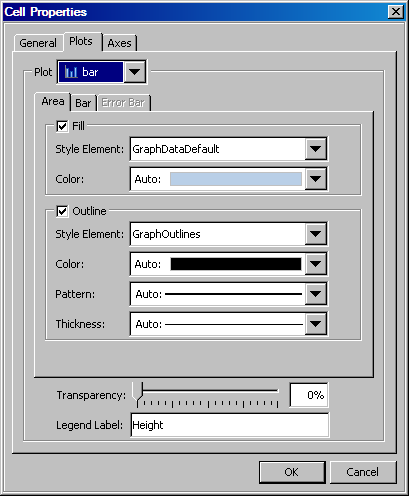
The default settings
also vary by plot type. For example, by default some plots have no
outline, and only Fill is selected, as shown
in the following display. If you select Outline, then the Fill check box can be cleared.
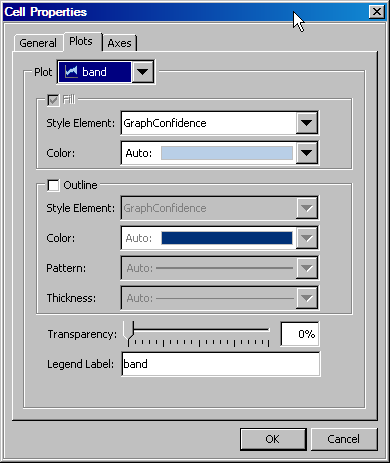
(Fill and Outline cannot both be cleared at the same time.) You can change the fill
or outline properties even if the check box is dimmed.
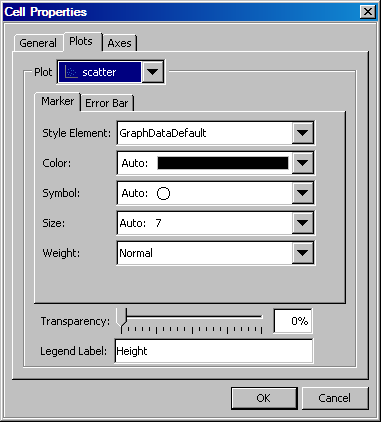
Marker Properties
You can specify the
style element from the list box. The style element varies by plot. For more information
about style elements, see Specifying Style Elements for Plot Properties.
You can specify the
following marker attributes:
-
marker color. For information about using the Color list box, see Using the Color List Box.
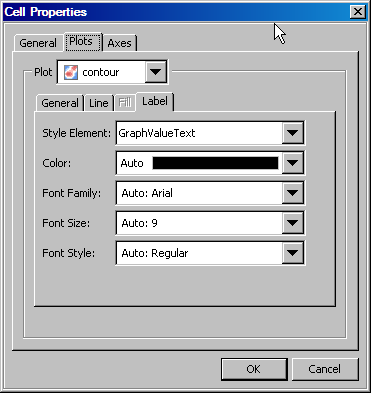
Text Properties
Text properties apply
to contour and block plots as well as other graphics elements such
as axis labels, titles, footnotes, and legends.
You can change the format
of the text by applying a different style element. The default style
element varies for different graphics elements. For more information,
see Specifying Style Elements for Text Properties.
You can specify the
following text attributes:
-
color of the text. For more information about selecting colors, see Using the Color List Box.
