On the Basic tab, double-click the SeriesPlot icon.
The Assign Data dialog box appears.
In the Assign
Data dialog box, complete these steps:
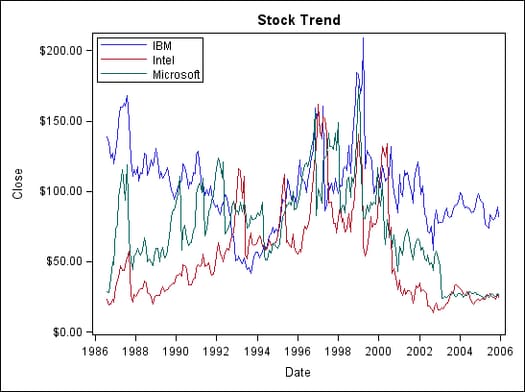
Select SASHELP from the Library list box.
Select STOCKS from the Data Set list box.
Select DATE from the X list box.
Select CLOSE from the Y list box.
Select STOCK from the Group list box.
Click OK.
Step Two: Change a Plot Line Property
Change the line properties
of the plot so that all the lines are solid. The lines obtain their
appearance from the style element for the group. By changing the line
properties, you override that style element.
To change the line
properties:
Right-click anywhere
within the plot area and select Plot Properties. The Cell Properties dialog box appears
and displays the Plots tab.
From the Plot list box, select series if it is not already selected.
From the Pattern list box, select the solid line.
By default, Group is selected. This selection indicates that the
value is derived from the group variable. When you explicitly change
the pattern, you override the default value.
Click OK.
Step Three: Customize the Title and Remove the Footnote
To customize the title
and remove the footnote:
Double-click the placeholder
title. The placeholder text is highlighted:
In the text box, enter Stock Trend.
In the bottom left corner
of the graph, right-click the placeholder footnote and select Remove Footnote from the pop-up menu.
Step Four: Add and Reposition a Discrete Legend
To add and reposition
a discrete legend:
Click and drag the Discrete Legend icon from the Insets panel to the bottom of the plot area. The legend is placed near
the X axis (where you dragged it).
Right-click the legend
and select Legend Properties. The Legend Properties dialog box appears.
From the Position list box, select Top Left, and then click OK.
The legend is moved
to the top left corner of the graph.