Example: Create a Scatter Plot with Modified Axis Labels and Two Titles

About This Example

In this example, you create a scatter plot from a blank graph window. You also do the following:
  • modify the axis labels
  • add two titles and apply a different style element to the second title
  • change the style that is applied to the graph
Here is the graph that you create in this example:
Scatter Plot
Scatter Plot
There are several ways to create and customize this graph. The following steps show one way to create the graph.

Step One: Create the Graph and Assign Data

To create the graph and assign data:
  1. Click the New Blank Graph New Blank Graph icon toolbar button.
  2. Click and drag the Scatter plot icon from the Plot Layers panel to the blank graph window. The Assign Data dialog box appears.
  3. In the Assign Data dialog box, complete these steps:
    • Select SASHELP from the Library list box.
    • Select IRIS from the Data Set list box.
    • Select PETALLENGTH from the X list box.
    • Select PETALWIDTH from the Y list box.
  4. Click OK.

Step Two: Modify the Axis Labels

Change the axis labels by removing “(mm)” from the labels.
To modify the axis labels:
  1. Right-click the X axis label and select Axis Properties. The Cell Properties dialog box appears and displays the Axes tab.
  2. In the Label text box, remove (mm).
  3. From the Axis list box, select Y. Then repeat the previous step for the Y axis.
  4. Click OK.

Step Three: Add Two Titles and Customize the Second Title

Add two titles and apply a different style element to the second title.
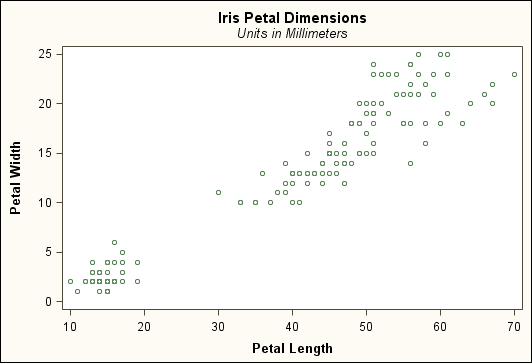
To add and modify titles:
  1. Click Title icon in the toolbar. A new title text box is added above the graph.
  2. In the title text box, enter Iris Petal Dimensions.
  3. To add the second title, repeat the previous steps and enter Units in Millimeters for the title text.
  4. Right-click the second title and select Title Properties from the pop-up menu. The Text Properties dialog box appears.
  5. From the Style Element list box, select GraphFootnoteText. Then select OK. The title now has a different appearance.
A style element is a component of an ODS style. Changing the style element enables you to obtain a different look for the title without overriding the style. In the next step, when you change the style that is applied to the graph, the appearance of the title is suitable to the new style.

Step Four: Change the Graph's Style

To change the graph's style:
  1. Right-click the graph and select Graph Properties. The Graph Properties dialog box appears.
  2. From the Style list box, select Analysis.
  3. Click OK.