Using ODS Graphics Functionality to Create Graphs
By default, ODS Graphics
are enabled for many SAS procedures. However, you might need to request
particular plots using procedure options. For procedures that support
ODS Graphics, these options are described in the “Syntax”
section of the procedure chapter of the respective user’s guide.
You typically request graphs with the PLOTS= option in the procedure
statement.
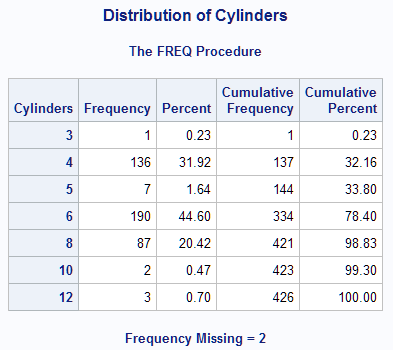
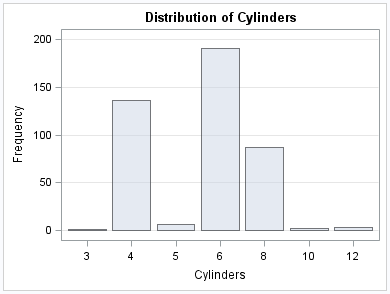
The following example
uses the FREQ procedure to provide a frequency distribution based
on the number of car cylinders. In this example, you do not need to
specify the ODS GRAPHICS statement. ODS Graphics functionality is
enabled by default for the FREQ procedure. However, this example specifies
the PLOTS= option in the TABLES statement in order to produce graphical
output.
title1 "Distribution of Cylinders";
proc freq data=sashelp.cars;
  tables Cylinders / plots=freqplot;
run;
title1;