Replaying Your SAS/GRAPH Output
You can use the GREPLAY procedure or the ODS DOCUMENT
destination and the DOCUMENT procedure to replay your SAS/GRAPH output.
Replaying Your Output Using the GREPLAY Procedure
For the SAS/GRAPH procedures
that support GRSEGs, you can use the GREPLAY procedure to replay your
graph GRSEGs without having to rerun your DATA step and procedures.
You can replay all of your graphs or only the ones that you select.
When you replay your graphs, use the same device that you used when
you generated the original graphs. If you use a different device,
your replayed graphs might be distorted.
You can replay your
graphs to the GRAPH window for viewing or
to a graphics output file. Here is an example that replays all of
the graphs in the WORK.GSEG catalog to the GRAPH window for viewing:
ods html close;
ods listing;
goptions reset=all;
proc greplay igout=work.gseg nofs;
   replay _all_;
run;
quit;
ods listing close;
ods html;
You can also use the
GREPLAY procedure to replay multiple graphs to a single file for the
graphic and document formats that support multiple images per file.
See Using the GREPLAY Procedure to Store Multiple Graphs in One Graphics Output File and Generating Web Animation with GIFANIM.
For information about
the GREPLAY procedure, see GREPLAY Procedure.
Replaying Output Using the DOCUMENT Procedure
About the DOCUMENT Procedure
For all of the SAS/GRAPH
procedures, you can use the DOCUMENT procedure to replay output that
you created. Use the ODS DOCUMENT destination, without having to rerun
your DATA step and procedures. The ODS DOCUMENT destination creates
ODS output objects for your output. You can replay the output objects
at any time to your monitor or to a different device.
Creating Your ODS Document
Here is an example that
shows how to create an ODS document containing three pie charts and
how to store it in catalog Mygraphs.Mydocs. The pie charts are generated
with the JAVA device.
/* Create the Mygraphs catalog */
LIBNAME Mygraphs "./";

/* Open the DOCUMENT destination. Specify catalog */
/* Mygraphs.Mydocs for the output and give it write permission */
ods document name=Mygraphs.Mydocs(write);

/* Open the HTML destination, and specify the JAVA device. */
ods html style=seaside;
goptions reset=all device=java;

/* Generate the charts */
proc gchart data=sashelp.cars gout=Mygraphs.Mydocs;
   pie Make / other=2;
      title1 "30 MPG or Better";
      where MPG_Highway >= 30;
   run;
   pie Make / other=3;
      title1 "Between 20 MPG and 29 MPG";
      where MPG_Highway < 30 and MPG_Highway >=20;
   run;
   pie Make / other=3;
      title1 "19 MPG or less";
      where MPG_Highway < 20;
   run;
quit;

/* Close the HTML and DOCUMENT destinations */
ods html close;
ods document close;

/* Reopen the HTML destination */
ods html;
Replaying Your ODS Document
After you create your
ODS document, use the DOCUMENT procedure to replay it. You can replay
all of the graphs in your document or only those that you select.
To see a list of the graphs in an ODS document, use a LIST statement
with the DOCUMENT procedure. Here is an example that shows how to
list the graphs in Mygraphs.Mydocs.
A list of the graphs
in the document is displayed in the Output window as shown in the following figure.
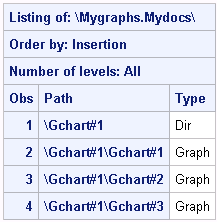
In this example, the
graphs are listed in the order in which they were inserted into the
catalog. To replay individual graphs, you must know the path to the
graphs, which is shown in the Path column.
Here is an example that
shows how to play the first and the third graphs in the Mygraphs.Mydocs
catalog to the ODS RTF destination using the ACTIVEX device.
goptions reset=all device=activex;
ods html close;
ods rtf style=money;
proc document name=Mygraphs.Mydocs;
   replay \Gchart#1\Gchart#1 / levels=all dest=rtf;
   replay \Gchart#1\Gchart#3 / levels=all dest=rtf;
   run;
quit;
ods rtf close;
ods html;