GAREABAR Procedure

Example 1: Generating an Area Bar Chart
| Features: |
VBAR Statement |
| Sample library member: | GABSUMVR |
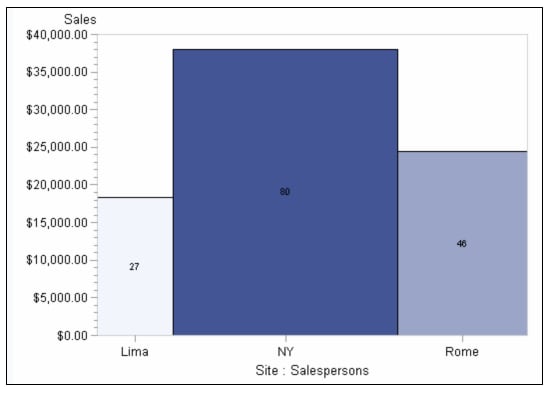
This area bar chart
reveals three geographic sites (Lima, NY, Rome) along the horizontal
axis. The width of each bar represents the sum of the salespersons
assigned to each site. The height of each bar represents the sum of
the sales for each site. The chart shows that NY had the greatest
sales, as well as the greatest number of salespersons.
Program
goptions reset=all dev=activex;
data totals;
 input Site $ Quarter Sales Salespersons;
format Sales dollar12.2;
datalines;
Lima   1 4043.97   4
NY      1 8225.26  12
Rome 1 3543.97    6
Lima  2 3723.44    5
NY     2 8595.07   18
Rome  2 5558.29   10
Lima  3 4437.96    8
NY     3 9847.91   24
Rome 3 6789.85   14
Lima 4 6065.57   10
NY     4 11388.51  26
Rome 4 8509.08   16
;
proc gareabar data=totals;
   vbar site*salespersons /
      sumvar=sales;
run;
quit;
Program Description
data totals;
 input Site $ Quarter Sales Salespersons;
format Sales dollar12.2;
datalines;
Lima   1 4043.97   4
NY      1 8225.26  12
Rome 1 3543.97    6
Lima  2 3723.44    5
NY     2 8595.07   18
Rome  2 5558.29   10
Lima  3 4437.96    8
NY     3 9847.91   24
Rome 3 6789.85   14
Lima 4 6065.57   10
NY     4 11388.51  26
Rome 4 8509.08   16
;