GAREABAR Procedure

Overview: GAREABAR Procedure
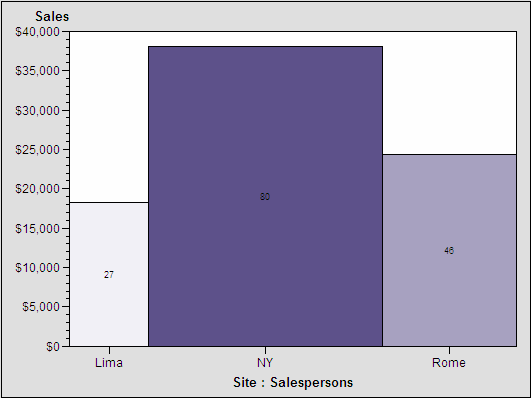
The GAREABAR procedure
produces an area bar chart displaying two statistics for each category
of data. For example, in the following chart, for each bar, the width,
and the height of each bar represent different values, proportionally.
The chart creates one bar for each unique value of the SITE variable.
The height of each bar represents the SUM of the sales for that SITE.
The width of each bar represents the number of salespersons generating
revenue for that site.