GANNO Procedure

Overview: GANNO Procedure
The GANNO
procedure displays graphs created by Annotate data sets. The procedure
can also be used to scale data-dependent graphics to fit the graphics
output area. Note that the GANNO procedure ignores all currently defined
title and footnote statements and some graphics option specifications,
including BORDER=. To include titles, footnotes, and graphics options
along with your Annotate data set, use the GSLIDE procedure instead
of the GANNO procedure. For more information about the Annotate facility,
see Using Annotate Data Sets.
By default, both the
GANNO and GSLIDE procedures scale graphics output from the data set
to fill the entire graphics area. However, if you are using a data
coordinate system and the data values are so large that some of the
graphics elements do not fit in the graphics output area and are not
displayed, you can use the GANNO procedure with the DATASYS option.
This will cause the procedure to scale the output to fit the available
space. The GSLIDE procedure does not have this capability.
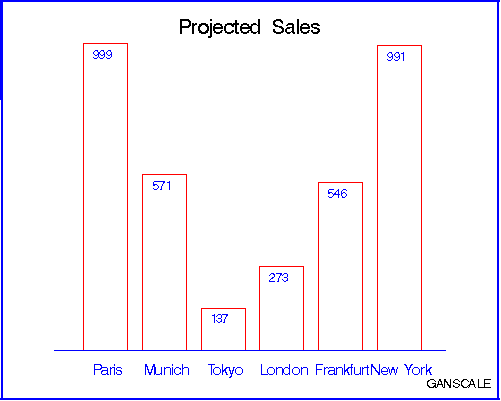
Displaying Annotate Graphics with the GANNO Procedure displays output from an Annotate data set.
The program for this
graph is in Scaling Data-Dependent Output.