Types of Web Presentations Available
ActiveX Controls, Java Applets, and Static Graphs
Delivering information
via the Web frequently requires a Web presentation that includes not
only tables but graphics as well. SAS/GRAPH provides three basic ways to display presentations
that include graphics. Presentations can be displayed
The ActiveX control
displays the output of SAS/GRAPH procedures. It enables such features as pop-up data tips, drill-down
links, and interactive menus. For more information, see Presentations That Use the ActiveX Control.
Java applets display
the output of SAS/GRAPH
procedures and macros. Depending on the applet, it can enable such
features as data tips, drill-down links, or interactive features available
through a pop-up menu. For more information, see Presentations That Use Java Applets.
You can also generate
graphs that do not have any interactive features but do have interactive
capabilities such as data tips or drill-down links. Static graphs
can be generated as GIF, JPEG, PNG, or SVG files. For more information,
see Presentations That Use Static Images and Using Scalable Vector Graphics.
Presentations That Use the ActiveX Control
The SAS/GRAPH ActiveX control displays the output
of SAS/GRAPH procedures
and enables extensive interactive features via a pop-up menu. The
pop-up menus enable you to rotate, and zoom, and to control the properties
of graphs such as its colors, legends, and axes.
You can enable pop-up
data tips and drill-down links with presentations created for the
ActiveX control.
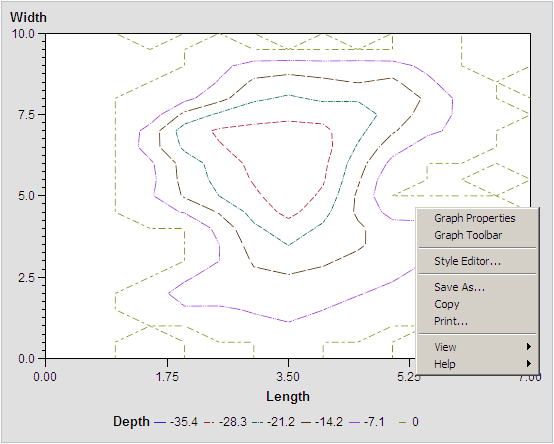
Sample ActiveX Presentation shows output from the GCONTOUR procedure as displayed by
the ActiveX control. (You can open the pop-up menu for the ActiveX
control by positioning your cursor over the graph and pressing the
right mouse button.)
The ActiveX control
can be viewed only in Windows operating environments with Microsoft
Internet Explorer on a PC with the ActiveX control installed.
The ActiveX control displays output from the G3D, GAREABAR,
GBARLINE, GCHART, GCONTOUR, GMAP, GPLOT, GRADAR, and GTILE procedures.
To create a graph to
be displayed by ActiveX, specify DEVICE=ACTIVEX on your GOPTIONS statement.
See Using ODS HTML with a SAS/GRAPH Procedure and Creating Interactive Output for ActiveX for more information.
Presentations That Use Java Applets
Java Applets That SAS/GRAPH Generates
If you want to deliver
your presentation to more operating environments than just Windows,
you can use one of the following Java applets:
Graph, Map, Tile Chart, and Contour Applets
Like the ActiveX control,
the Graph, Map, Tile Chart, and Contour applets display the output
of SAS/GRAPH procedures
and enable extensive interactive features. The Graph, Map, Tile Chart,
and Contour applets enable interactive features such as data tips
and drill-down links, and they provide pop-up menus which enable the
user to change properties such as the graph's colors, legends, and
axes.
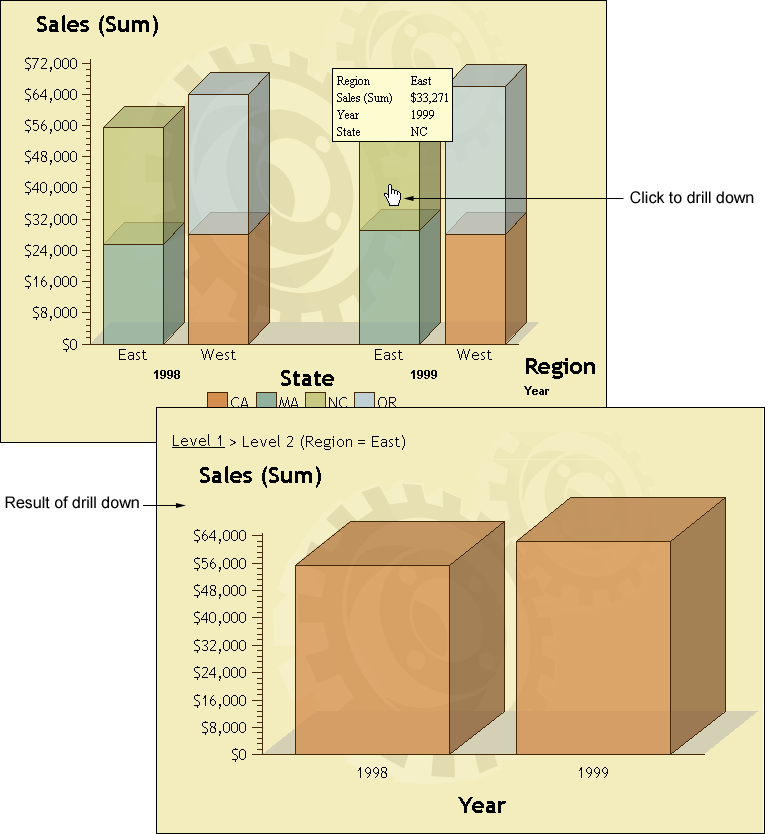
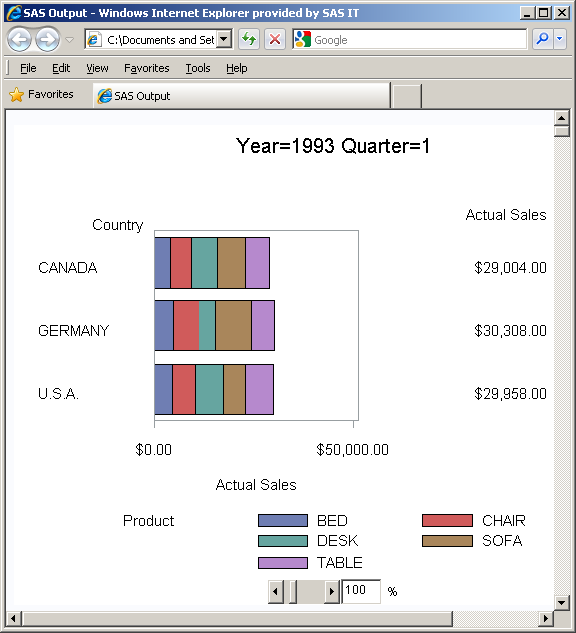
Sample Java Presentation shows PROC GCHART output displayed by the Java Graph applet
showing data tips and drill-down capability.
These applets display
the output of the following SAS/GRAPH procedures:
To create a graph to be displayed by one of these applets,
specify DEVICE=JAVA on your GOPTIONS statement. For more information,
see Using ODS HTML with a SAS/GRAPH Procedure and Creating Interactive Output for Java.
Treeview Applet
This applet displays
a treeview diagram that shows the parent-child relationships in a
tree structure. In a treeview diagram, each child node has exactly
one parent, and each parent node has zero or more children. In other
words, the relationships in a treeview diagram are one-to-many. A
treeview diagram is ideal for displaying such data as organizational
charts or the hierarchical relationships of the pages of a Web site.
By default, the Treeview
applet zooms in on the portion of the tree that is in the center of
the display, as if you were looking through a fish-eye lens. Nodes
in the center of the display are spread apart and shown with more
detail, including node labels. Nodes near the periphery of the display
are compressed and shown with less detail. Initially, the Treeview
applet places the root node in the center of the display. You can
click and drag the diagram to change the portion of the diagram that
is in the center of the display.
The Treeview applet
supports a pop-up menu that enables you to search for nodes, select
or hide subtrees, and so on. You can add hotspots that link to Web
pages when the user clicks on a node.
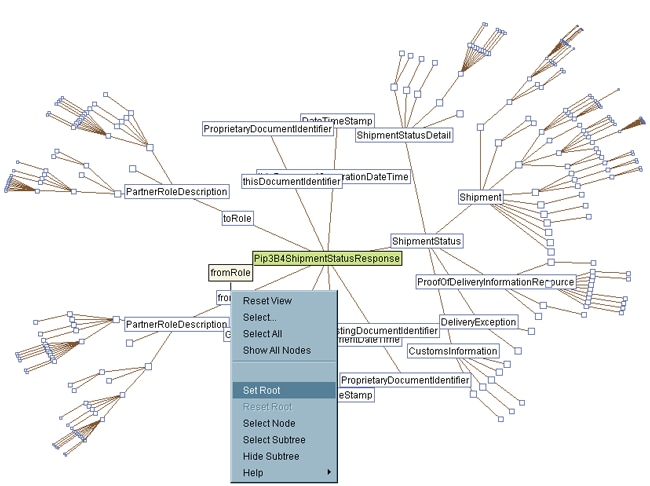
For example, Sample Treeview Diagram shows a treeview
diagram (with the pop-up menu opened) displaying the structure of
an XML Document Type Definition.
To generate a treeview
diagram, use the DS2TREE macro. For more information,
see Creating Interactive Treeview Diagrams.
Constellation Applet
The Constellation applet
displays a general node-link diagram. Each node can be linked to one
or more other nodes. Unlike the Treeview applet, the Constellation
applet does not require a hierarchical relationship between the nodes.
(Although it can be used to display hierarchical relationships, the
Constellation applet does not automatically place the root node at
the center of the display.)
The Constellation applet
supports node and link properties that determine the color and size
of the nodes and the color and thickness of the link joining the nodes.
These properties indicate the relative strength of the relationship
between the nodes.
Like the Treeview applet,
by default, the Constellation applet zooms in on the portion of the
diagram that is in the center of the display, as if you were looking
through a fish-eye lens. Nodes in the center of the display are spread
apart and shown with more detail, including node labels. Nodes near
the periphery of the display are compressed and shown with less detail.
You can click and drag the diagram to change the portion of the diagram
that is in the center of the display.
The Constellation applet
has a pop-up menu that supports several functions such as highlighting
specific links and searching for specific nodes. You can add hotspots
that link to Web pages when the user clicks on a node.
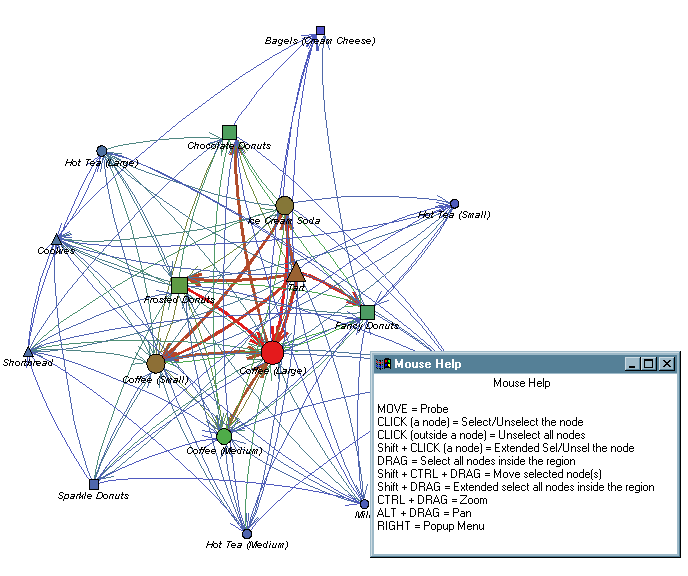
Sample Constellation Diagram shows a constellation diagram (with the Mouse Help menu
displayed).
To generate the Constellation
applet, use the DS2CONST macro. For more information,
see Creating Interactive Constellation Diagrams.
Metaview Applet
The Metaview applet
displays the output of SAS/GRAPH procedures and enables interactive features that are not available
with static images such as GIFs or JPEGs. It enables zooming and scrolling
and supports pop-up menus with customized user-selectable links. When
you generate a graph with the Metaview applet, you can specify background
colors and text fonts, and enable drill-down links to HTML files,
metagraphics files, and sets of metacodes.
Sample Metaview Applet shows the zoom control that the Metaview applet provides.
The Metaview applet
displays output from the G3D, GANNO, GBARLINE, GCHART, GCONTOUR, GPLOT,
GMAP, GRADAR, GREPLAY, and GSLIDE procedures. To create a graph to
be displayed by the Metaview applet, specify DEVICE=JAVAMETA on your
GOPTIONS statement.
For more information, see Generating Interactive Metagraphics Output.
Presentations That Use Static Images
Devices for Generating Static Images
If you do not need any
interactive features in your presentations, then you can specify one
of the following device drivers to generate a presentation that uses
a GIF, JPEG, or PNG file.
To generate a Web presentation that uses one of these
drivers, specify the driver name with the DEVICE= option in your GOPTIONS
statement. All of these device drivers generate output from SAS/GRAPH procedures.
create a Web presentation
that uses a static PNG image instead of an interactive applet. The
images are identical to the images generated with the ACTIVEX and
JAVA device drivers.
generates scalable
graphics vector files that can be viewed in browsers that support
SVG graphics.For more information, see Using Scalable Vector Graphics.
ACTXIMG Presentations
You
can use the ACTXIMG device driver to create a presentation that uses
a PNG file that is identical in appearance to the image produced with
the ACTIVEX device driver.
A presentation generated
with the ACTXIMG driver supports data tips and drill-down links for
GCHART, GBARLINE, and GPLOT (except for high-low plots) output.
To render your output
(create the PNG file), the ActiveX control must be installed on the
PC where your SAS session is running. Because of this requirement,
ACTXIMG presentations can be generated only on PCs. When you specify
the ACTXIMG device driver, the output is rendered when your Web presentation
is generated, and the user does not need to have the ActiveX control
installed to view it.
JAVAIMG Presentations
You can use the JAVAIMG
device driver to create a presentation that uses a PNG file that
is identical in appearance to the image produced with the JAVA device
driver.
The appropriate Java
applet (Graph, Map, Tile Chart, or Contour applet) is required to
render your output (create the PNG file). The appropriate Java applet
must be installed on the machine where your SAS session is running.
When you specify the JAVAIMG device driver, the output is rendered
when your Web presentation is generated, and the user does not need
to have any Java applet files installed to view it.
GIF, JPEG, and PNG Presentations
For Web presentations
generated with the GIF, JPEG, or PNG device drivers, you can add pop-up
data tips that are displayed when the cursor is over a portion of
the image and links to other Web pages.
Animated GIF Presentations
An animated presentation
is a series of static images that are displayed automatically one
after the other. Specify DEVICE=GIFANIM in your GOPTIONS statement
to generate a Web presentation that displays a series of images from
a single GIF file. You can control the rate at which the successive
images are presented.
You can generate animated
GIF presentations from the G3D, GANNO, GBARLINE, GCHART, GCONTOUR,
GPLOT, GMAP, GRADAR, GREPLAY, and GSLIDE procedures.
For more information,
see Generating Web Animation with GIFANIM.
Note: For general information about the SVG universal printers,Creating SVG (Scalable Vector Graphics) Files Using Universal Printing in SAS Language Reference: Concepts.For information about generating animated presentations
with the SVGANIM universal printer, see Animating Output with the SVGANIM Printer.