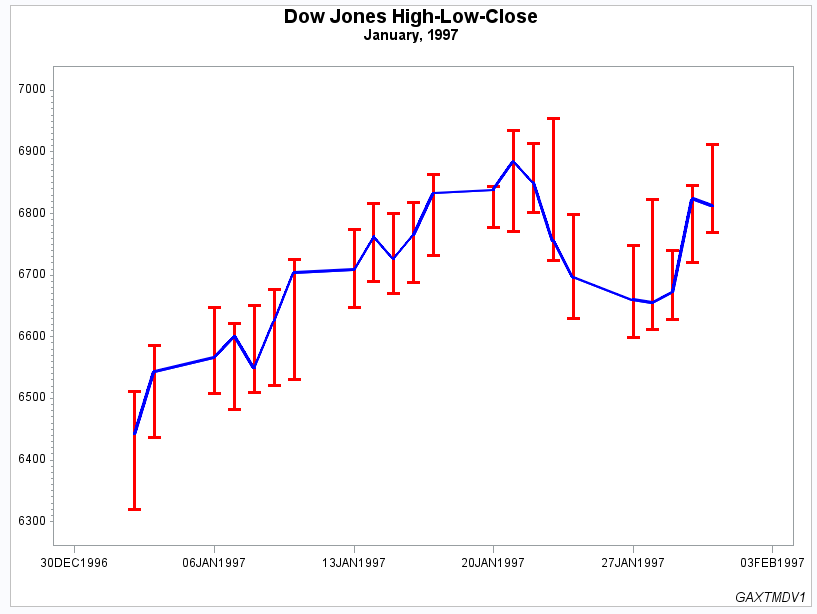
Example 1: Ordering Axis Tick Marks with SAS Date Values
| Features: |
FOOTNOTE statement option: JUSTIFY=
GOPTIONS statement options: BORDER |
| Sample library member: | GAXTMDV1 |
This example uses SAS
datetime values with an AXIS statement's ORDER= option to set the
major tick marks on the horizontal axis. It adjusts the position of
the first and last major tick marks. The example also uses HILOCTJ
interpolation in a SYMBOL statement to join minimum and maximum values.
Program
goptions reset=all border;
data dowhlc;
     input date date9. high low close;
     format date date9.;
     datalines;
02JAN1997   6511.38  6318.96  6442.49
03JAN1997   6586.42  6437.10  6544.09
06JAN1997   6647.22  6508.30  6567.18
07JAN1997   6621.82  6481.75  6600.66
08JAN1997   6650.30  6509.84  6549.48
09JAN1997   6677.24  6520.23  6625.67
10JAN1997   6725.35  6530.62  6703.79
13JAN1997   6773.45  6647.99  6709.18
14JAN1997   6816.17  6689.94  6762.29
15JAN1997   6800.77  6669.93  6726.88
16JAN1997   6818.47  6688.40  6765.37
17JAN1997   6863.88  6732.66  6833.10
20JAN1997   6839.13  6777.30  6843.87
21JAN1997   6934.69  6771.14  6883.90
22JAN1997   6913.14  6801.16  6850.03
23JAN1997   6953.55  6724.19  6755.75
24JAN1997   6798.08  6629.91  6696.48
27JAN1997   6748.82  6598.73  6660.69
28JAN1997   6823.48  6612.20  6656.08
29JAN1997   6673.39  6627.98  6740.74
30JAN1997   6845.03  6719.96  6823.86
31JAN1997   6912.37  6769.99  6813.09
;
data dowhlc2;
   set dowhlc;
   drop high low close;
   dow=high; output;
   dow=low; output;
   dow=close; output;
run;
title1 "Dow Jones High-Low-Close";
title2 "January, 1997";
footnote justify=right "GAXTMDV1 ";
symbol interpol=hiloctj
       cv=red
       ci=blue
       width=2;
axis1 order=("30DEC1996"d to "03FEB1997"d by week)
      offset=(3,3)
      label=none ;
axis2
      label=none
      offset=(2,2);
proc gplot data=dowhlc2;
   plot dow*date / haxis=axis1
                   vaxis=axis2;
run;
quit;
Program Description
Create the data set. DOWHLC
contains the high, low, and close values of the Dow Jones Industrial
index for each business day for a month.
data dowhlc;
     input date date9. high low close;
     format date date9.;
     datalines;
02JAN1997   6511.38  6318.96  6442.49
03JAN1997   6586.42  6437.10  6544.09
06JAN1997   6647.22  6508.30  6567.18
07JAN1997   6621.82  6481.75  6600.66
08JAN1997   6650.30  6509.84  6549.48
09JAN1997   6677.24  6520.23  6625.67
10JAN1997   6725.35  6530.62  6703.79
13JAN1997   6773.45  6647.99  6709.18
14JAN1997   6816.17  6689.94  6762.29
15JAN1997   6800.77  6669.93  6726.88
16JAN1997   6818.47  6688.40  6765.37
17JAN1997   6863.88  6732.66  6833.10
20JAN1997   6839.13  6777.30  6843.87
21JAN1997   6934.69  6771.14  6883.90
22JAN1997   6913.14  6801.16  6850.03
23JAN1997   6953.55  6724.19  6755.75
24JAN1997   6798.08  6629.91  6696.48
27JAN1997   6748.82  6598.73  6660.69
28JAN1997   6823.48  6612.20  6656.08
29JAN1997   6673.39  6627.98  6740.74
30JAN1997   6845.03  6719.96  6823.86
31JAN1997   6912.37  6769.99  6813.09
;
Prepare the data for a high-low plot. DOWHLC2 generates three records for each date, storing
each date's high, low, and close values in variable DOW.
data dowhlc2;
   set dowhlc;
   drop high low close;
   dow=high; output;
   dow=low; output;
   dow=close; output;
run;
Define titles and footnote. JUSTIFY=RIGHT
in the FOOTNOTE statement causes the footnote to be displayed in the
bottom right.
Define symbol characteristics. INTERPOL=HILOCTJ
specifies that the minimum and maximum values of DOW are joined by
a vertical line with a horizontal tick mark at each end. The close
values are joined by straight lines. The CV= option controls the color
of the symbol. The CI= and WIDTH= options control the color and the
thickness of the line that joins the close points.
Define characteristics of the horizontal axis. The ORDER= option uses a SAS date value to set the
major tick marks. The OFFSET= option moves the first and last tick
marks to make room for the tick mark value.