Example 2: Specifying Logarithmic Axes
| Features: |
TITLE statement options: MOVE= GOPTIONS statement options: GUNIT |
| Sample library member: | GAXSPLA1 |
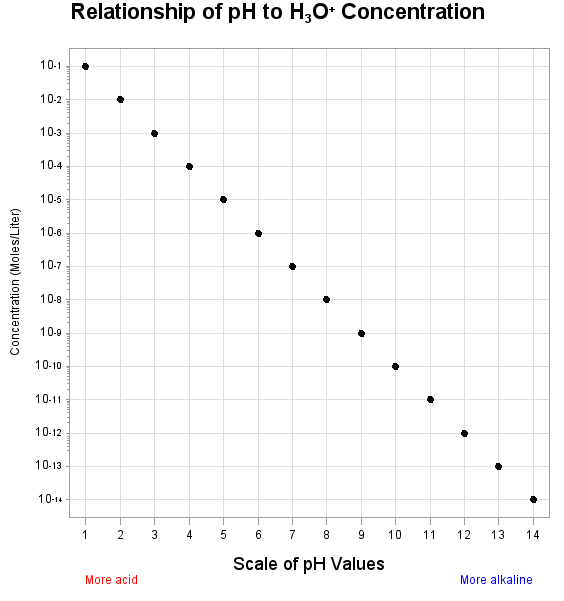
This example illustrates
the AXIS statement options LOGBASE= and LOGSTYLE=. The horizontal
axis represents pH level. The vertical axis, which represents the
concentration of the hydroxide ion expressed as moles per liter, is
scaled logarithmically. In addition, this example shows how the TICK=
parameter of the VALUE= option modifies individual tick marks. It
also uses the MOVE= option in a TITLE statement to position the title's
subscript and superscript text.
Program
goptions reset=all gunit=pct;
data concentr;
   input ph conc;
   datalines;
1  1E-1
2  1E-2
3  1E-3
4  1E-4
5  1E-5
6  1E-6
7  1E-7
8  1E-8
9  1E-9
10 1E-10
11 1E-11
12 1E-12
13 1E-13
14 1E-14
;
run;
title1 h=3.7 "Relationship of pH to H"
       move=(-0,-.75) h=2 "3"
       move=(+0,+.75) h=3.7 "O"
       move=(+0,+.75) h=2 "+"
       move=(-0,-.75) h=3.7  " Concentration";
symbol value=dot color=black height=2;
axis1 label=(h=3 "Scale of pH Values"
             justify=left color=red h=2 "More acid"
             justify=right color=blue "More alkaline")
      minor=none
      length=60
      offset=(2,2);
axis2 logbase=10
      logstyle=expand
       label=(angle=90 h=2 color=black
             "Concentration (Moles/Liter)" )
      value=(tick=1 "10" height=1.2 "-14"
             tick=2 "10" height=1.5 "-13"
             tick=3 "10" height=1.5 "-12"
             tick=4 "10" height=1.5 "-11"
             tick=5 "10" height=1.5 "-10"
             tick=6 "10" height=1.5 "-9"
             tick=7 "10" height=1.5 "-8"
             tick=8 "10" height=1.5 "-7"
             tick=9 "10" height=1.5 "-6"
             tick=10 "10" height=1.5 "-5"
             tick=11 "10" height=1.5 "-4"
             tick=12 "10" height=1.5 "-3"
             tick=13 "10" height=1.5 "-2"
             tick=14 "10" height=1.5 "-1")
              offset=(3,3);
proc gplot data= concentr;
   plot conc*ph / haxis=axis1
                  vaxis=axis2
                  autohref chref=graydd
                  autovref cvref=graydd;
run;
quit;
Program Description
Set the graphics environment. The
GUNIT option specifies the default unit of measure to use with height
specifications.
data concentr;
   input ph conc;
   datalines;
1  1E-1
2  1E-2
3  1E-3
4  1E-4
5  1E-5
6  1E-6
7  1E-7
8  1E-8
9  1E-9
10 1E-10
11 1E-11
12 1E-12
13 1E-13
14 1E-14
;
run;
Define title and footnote. The
MOVE= option positions subscript 3 and superscript +. Each new position
is relative to the last position specified by the MOVE= option.
title1 h=3.7 "Relationship of pH to H"
       move=(-0,-.75) h=2 "3"
       move=(+0,+.75) h=3.7 "O"
       move=(+0,+.75) h=2 "+"
       move=(-0,-.75) h=3.7  " Concentration";
Define characteristics for horizontal axis. The LABEL= option uses the JUSTIFY= suboption to
create a descriptive two-line label that replaces the variable name
PH. MINOR=NONE removes all minor tick marks. The LENGTH= option controls
the length of the horizontal axis. The OFFSET= option specifies the
distance from the first and last major tick marks to the ends of the
axis line.
axis1 label=(h=3 "Scale of pH Values"
             justify=left color=red h=2 "More acid"
             justify=right color=blue "More alkaline")
      minor=none
      length=60
      offset=(2,2);
Define characteristics for vertical axis. LOGBASE=10 scales the vertical axis logarithmically,
using a base of 10. Each major tick mark represents a power of 10.
LOGSTYLE=EXPAND displays minor tick marks in logarithmic progression.
The LABEL= option uses the ANGLE= suboption to place the label parallel
to the vertical axis. The VALUE= option displays the major tick mark
values as 10 plus an exponent. The HEIGHT= suboption for each TICK=
specification affects only the text following it.
axis2 logbase=10
      logstyle=expand
       label=(angle=90 h=2 color=black
             "Concentration (Moles/Liter)" )
      value=(tick=1 "10" height=1.2 "-14"
             tick=2 "10" height=1.5 "-13"
             tick=3 "10" height=1.5 "-12"
             tick=4 "10" height=1.5 "-11"
             tick=5 "10" height=1.5 "-10"
             tick=6 "10" height=1.5 "-9"
             tick=7 "10" height=1.5 "-8"
             tick=8 "10" height=1.5 "-7"
             tick=9 "10" height=1.5 "-6"
             tick=10 "10" height=1.5 "-5"
             tick=11 "10" height=1.5 "-4"
             tick=12 "10" height=1.5 "-3"
             tick=13 "10" height=1.5 "-2"
             tick=14 "10" height=1.5 "-1")
              offset=(3,3);