How Graphics Elements Are Placed in the Graphics Output Area
By default, SAS/GRAPH software positions certain graphics
elements in predefined locations in the graphics output area.
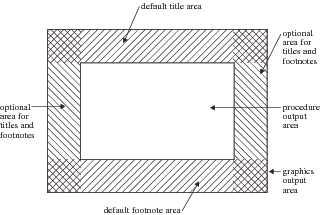
Default Locations for Graphics Elements in the Graphics Output Area shows the graphics
output area and the areas within it that are used by the following
graphics elements:
-
Legends use the procedure output area and can affect the amount of space available for the graph. By default, space is reserved for the legend below the axis area of a graph and above the footnote area. However, you can position the legend in the part of the procedure output area that is reserved for the graph. For details, see the LEGEND Statement.
Note: Titles and footnotes can
be positioned elsewhere on the graph as well, with different effects
on space allocation. See TITLE, FOOTNOTE, and NOTE Statements for details. For destinations other than the LISTING destination, some
graphics elements, such as the title and footnote, can appear in the
graphics output instead of the procedure output area.
Note: If the titles, footnotes,
and legend are very large, they can make the procedure output area
too small for the graph. You can control the size of title and footnote
text and of most legend elements with statement options. For details, see SAS/GRAPH Statements for a description
of the appropriate statement. In addition, the GOPTIONS Statement lists the graphics
options that control the size of various graphics elements.